TECHNICAL ASSET FINGERPRINT
a45d365f3a1e86f373497923
Click to view fullscreen
Press ESC or click to close
FOUND IN PAPERS
EXPERT: healer-alpha-free VERSION 1
RUNTIME: free/openrouter/healer-alpha
INTEL_VERIFIED
\n
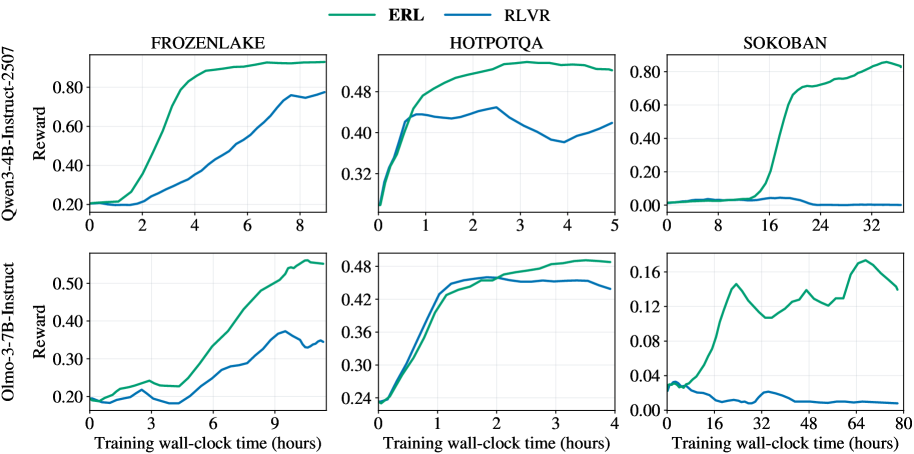
## Line Chart Grid: ERL vs. RLVR Training Performance
### Overview
The image displays a 2x3 grid of line charts comparing the training performance of two reinforcement learning methods, **ERL** (green line) and **RLVR** (blue line). Performance is measured by "Reward" over "Training wall-clock time (hours)". The top row shows results for the **Qwen3-4B-Instruct-2507** model, and the bottom row for the **Olmo-3-7B-Instruct** model. Each column corresponds to a different task environment: **FROZENLAKE**, **HOTPOTQA**, and **SOKOBAN**.
### Components/Axes
* **Legend:** Located at the top center of the entire figure. It defines two data series:
* **ERL:** Represented by a solid green line.
* **RLVR:** Represented by a solid blue line.
* **Y-Axis (All Charts):** Labeled **"Reward"**. The scale and range vary per chart.
* **X-Axis (All Charts):** Labeled **"Training wall-clock time (hours)"**. The scale and range vary per chart.
* **Row Labels (Left Side):**
* Top Row: **"Qwen3-4B-Instruct-2507"**
* Bottom Row: **"Olmo-3-7B-Instruct"**
* **Column Titles (Top of Each Chart):**
* Left Column: **"FROZENLAKE"**
* Middle Column: **"HOTPOTQA"**
* Right Column: **"SOKOBAN"**
### Detailed Analysis
**1. Top Row: Qwen3-4B-Instruct-2507**
* **FROZENLAKE (Top-Left):**
* **Axes:** Y-axis from 0.20 to 0.80. X-axis from 0 to 8 hours.
* **ERL (Green):** Starts near 0.20. Shows a steep, near-linear increase from ~1 to 4 hours, reaching ~0.85. Plateaus near 0.90 from 4 to 8 hours.
* **RLVR (Blue):** Starts near 0.20. Increases more gradually and linearly, reaching ~0.75 by 8 hours. Consistently below ERL after the first hour.
* **HOTPOTQA (Top-Middle):**
* **Axes:** Y-axis from 0.32 to 0.48. X-axis from 0 to 5 hours.
* **ERL (Green):** Starts near 0.32. Rises sharply to ~0.46 by 1 hour, then continues a slower ascent to a peak of ~0.49 at 3 hours, before a slight decline to ~0.48 at 5 hours.
* **RLVR (Blue):** Starts near 0.32. Rises to ~0.44 by 0.5 hours, then fluctuates between ~0.44 and ~0.46, ending near 0.44 at 5 hours. Generally below ERL after the initial rise.
* **SOKOBAN (Top-Right):**
* **Axes:** Y-axis from 0.00 to 0.80. X-axis from 0 to 32 hours.
* **ERL (Green):** Remains near 0.00 until ~12 hours. Then exhibits a very steep, sigmoidal rise, reaching ~0.70 by 20 hours and peaking near 0.85 at 32 hours.
* **RLVR (Blue):** Remains flat near 0.00 for the entire 32-hour duration.
**2. Bottom Row: Olmo-3-7B-Instruct**
* **FROZENLAKE (Bottom-Left):**
* **Axes:** Y-axis from 0.20 to 0.50. X-axis from 0 to 9 hours.
* **ERL (Green):** Starts near 0.20. Shows a generally upward trend with some fluctuations, reaching ~0.50 by 9 hours.
* **RLVR (Blue):** Starts near 0.20. Fluctuates between ~0.18 and ~0.25 for the first 4 hours, then rises to ~0.35 by 9 hours. Consistently below ERL.
* **HOTPOTQA (Bottom-Middle):**
* **Axes:** Y-axis from 0.24 to 0.48. X-axis from 0 to 4 hours.
* **ERL (Green):** Starts near 0.24. Rises steeply to ~0.46 by 1.5 hours, then continues a slower ascent to ~0.48 by 4 hours.
* **RLVR (Blue):** Starts near 0.24. Rises steeply to ~0.46 by 1.5 hours, tracking ERL closely. After 2 hours, it plateaus and slightly declines to ~0.45 by 4 hours, falling slightly below ERL.
* **SOKOBAN (Bottom-Right):**
* **Axes:** Y-axis from 0.00 to 0.16. X-axis from 0 to 80 hours.
* **ERL (Green):** Starts near 0.04. Rises to a peak of ~0.15 at ~24 hours, then fluctuates between ~0.11 and ~0.17 for the remainder, ending near 0.14 at 80 hours.
* **RLVR (Blue):** Starts near 0.04. Shows a slight decline, fluctuating near or below 0.02 for the entire 80-hour duration.
### Key Observations
1. **Consistent Superiority of ERL:** In all six charts, the ERL (green) method achieves a higher final reward than the RLVR (blue) method.
2. **Task-Dependent Learning Curves:** The shape of the learning curve is highly dependent on the task.
* **FROZENLAKE:** Shows steady, linear improvement for both models.
* **HOTPOTQA:** Shows rapid initial learning followed by a plateau or slight decline.
* **SOKOBAN:** Shows a long "warm-up" period (especially for Qwen) followed by a sharp phase transition for ERL, while RLVR fails to learn.
3. **Model-Dependent Performance Scale:** The absolute reward values differ significantly between models for the same task. For example, on SOKOBAN, Qwen3-4B reaches ~0.85 reward, while Olmo-3-7B only reaches ~0.16, suggesting the task is much harder for the latter model or the reward scale is different.
4. **RLVR's Struggle on SOKOBAN:** RLVR shows near-zero learning on the SOKOBAN task for both models, indicating a potential failure mode or incompatibility with this environment's structure.
### Interpretation
This grid of charts provides a comparative analysis of two training algorithms (ERL and RLVR) across diverse reasoning and planning tasks (FROZENLAKE: simple navigation; HOTPOTQA: multi-hop question answering; SOKOBAN: complex puzzle-solving) and two different language model bases.
The data strongly suggests that **ERL is a more robust and effective training method** than RLVR across this set of conditions. It not only achieves higher final performance but also demonstrates more consistent learning dynamics. The dramatic difference in the SOKOBAN task is particularly telling; ERL is capable of unlocking performance after a significant training period, while RLVR shows no progress. This could imply that ERL's optimization strategy is better suited for tasks requiring long-horizon planning or sparse rewards.
The variation in learning curve shapes (linear, saturating, sigmoidal) across tasks highlights that the **difficulty and learning dynamics are not uniform**. The long delay before learning in SOKOBAN for the Qwen model suggests a critical threshold of experience or internal representation must be reached before the skill can emerge. The lower overall performance of the Olmo model, especially on SOKOBAN, may indicate differences in model architecture, pre-training data, or inherent capability for these specific types of reasoning tasks.
In summary, the visualization serves as evidence for the efficacy of the ERL method and illustrates how task complexity and model architecture interact to shape the trajectory of reinforcement learning in language models.
DECODING INTELLIGENCE...