## Line Chart: Performance of Different PRM Aggregation Techniques
### Overview
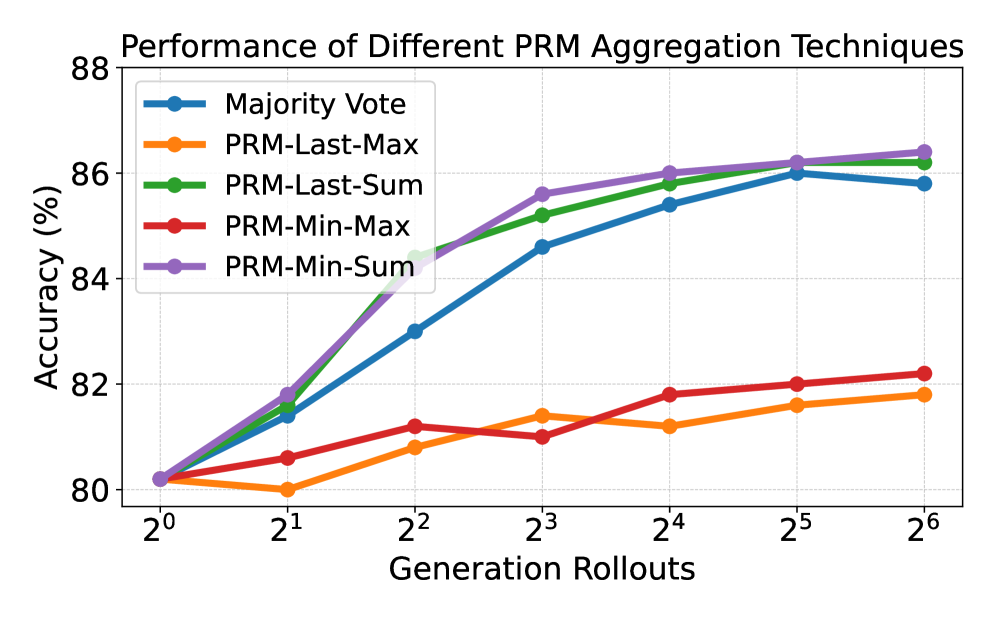
The image is a line chart comparing the performance of different PRM (presumably Probabilistic Roadmap) aggregation techniques. The chart plots accuracy (in percentage) against the number of generation rollouts (on a base-2 logarithmic scale). Five different PRM aggregation techniques are compared: Majority Vote, PRM-Last-Max, PRM-Last-Sum, PRM-Min-Max, and PRM-Min-Sum.
### Components/Axes
* **Title:** Performance of Different PRM Aggregation Techniques
* **X-axis:** Generation Rollouts (values: 2<sup>0</sup>, 2<sup>1</sup>, 2<sup>2</sup>, 2<sup>3</sup>, 2<sup>4</sup>, 2<sup>5</sup>, 2<sup>6</sup>)
* **Y-axis:** Accuracy (%) (values range from 80 to 88, with gridlines at each integer value)
* **Legend:** Located in the top-left corner, identifying each line by color and name:
* Blue: Majority Vote
* Orange: PRM-Last-Max
* Green: PRM-Last-Sum
* Red: PRM-Min-Max
* Purple: PRM-Min-Sum
### Detailed Analysis
* **Majority Vote (Blue):** Starts at approximately 80% accuracy at 2<sup>0</sup> rollouts. It increases sharply to approximately 81.5% at 2<sup>1</sup>, then to 83% at 2<sup>2</sup>, 84.5% at 2<sup>3</sup>, 85.5% at 2<sup>4</sup>, and plateaus around 86% at 2<sup>5</sup> and 2<sup>6</sup>.
* **PRM-Last-Max (Orange):** Starts at approximately 80% accuracy at 2<sup>0</sup> rollouts. It decreases slightly to approximately 79.8% at 2<sup>1</sup>, then increases to 81% at 2<sup>2</sup>, 81.5% at 2<sup>3</sup>, 81.2% at 2<sup>4</sup>, 81.7% at 2<sup>5</sup>, and 81.8% at 2<sup>6</sup>.
* **PRM-Last-Sum (Green):** Starts at approximately 80% accuracy at 2<sup>0</sup> rollouts. It increases sharply to approximately 81.8% at 2<sup>1</sup>, then to 84% at 2<sup>2</sup>, 85.5% at 2<sup>3</sup>, 86% at 2<sup>4</sup>, and plateaus around 86.2% at 2<sup>5</sup> and 2<sup>6</sup>.
* **PRM-Min-Max (Red):** Starts at approximately 80% accuracy at 2<sup>0</sup> rollouts. It increases slightly to approximately 80.5% at 2<sup>1</sup>, then to 81.2% at 2<sup>2</sup>, 81% at 2<sup>3</sup>, 81.8% at 2<sup>4</sup>, 82% at 2<sup>5</sup>, and 82.2% at 2<sup>6</sup>.
* **PRM-Min-Sum (Purple):** Starts at approximately 80% accuracy at 2<sup>0</sup> rollouts. It increases sharply to approximately 82% at 2<sup>1</sup>, then to 83% at 2<sup>2</sup>, 85% at 2<sup>3</sup>, 86% at 2<sup>4</sup>, and plateaus around 86.5% at 2<sup>5</sup> and 2<sup>6</sup>.
### Key Observations
* PRM-Min-Sum and PRM-Last-Sum achieve the highest accuracy among the tested techniques, closely followed by Majority Vote.
* PRM-Min-Max and PRM-Last-Max consistently show lower accuracy compared to the other techniques.
* All techniques show the most significant increase in accuracy between 2<sup>0</sup> and 2<sup>4</sup> generation rollouts. After 2<sup>4</sup>, the accuracy plateaus for most techniques.
### Interpretation
The chart demonstrates the performance of different PRM aggregation techniques as the number of generation rollouts increases. The PRM-Min-Sum and PRM-Last-Sum methods appear to be the most effective in terms of achieving higher accuracy. The plateauing of accuracy after 2<sup>4</sup> rollouts suggests a point of diminishing returns, where increasing the number of rollouts provides minimal improvement in performance. The relatively poor performance of PRM-Min-Max and PRM-Last-Max indicates that these aggregation methods may not be as suitable for this particular application.