\n
## Line Chart: Performance of Different PRM Aggregation Techniques
### Overview
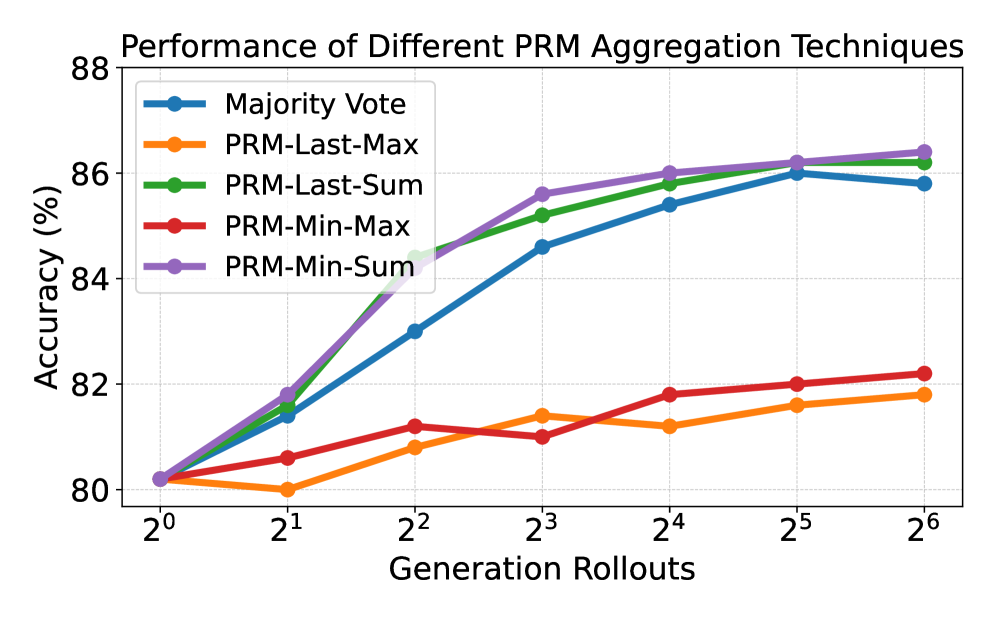
This line chart illustrates the performance, measured in accuracy (%), of five different Prompt Response Modeling (PRM) aggregation techniques across varying numbers of generation rollouts. The x-axis represents the generation rollouts (from 2⁰ to 2⁶), and the y-axis represents the accuracy percentage (from 80% to 88%). Each line represents a different aggregation technique, and the chart aims to compare their performance as the number of generation rollouts increases.
### Components/Axes
* **Title:** "Performance of Different PRM Aggregation Techniques" (Top-center)
* **X-axis Label:** "Generation Rollouts" (Bottom-center)
* **Markers:** 2⁰, 2¹, 2², 2³, 2⁴, 2⁵, 2⁶
* **Y-axis Label:** "Accuracy (%)" (Left-center)
* **Scale:** 80 to 88, with increments of approximately 2.
* **Legend:** Located in the top-left corner.
* **Labels & Colors:**
* Majority Vote (Blue)
* PRM-Last-Max (Orange)
* PRM-Last-Sum (Green)
* PRM-Min-Max (Red)
* PRM-Min-Sum (Purple)
### Detailed Analysis
Here's a breakdown of each line's trend and approximate data points, verified against the legend colors:
* **Majority Vote (Blue):** The line slopes upward, showing a consistent increase in accuracy with increasing generation rollouts.
* 2⁰: ~80%
* 2¹: ~81%
* 2²: ~83%
* 2³: ~85%
* 2⁴: ~86%
* 2⁵: ~86%
* 2⁶: ~86.5%
* **PRM-Last-Max (Orange):** The line shows a relatively flat trend with some fluctuations.
* 2⁰: ~80%
* 2¹: ~80.5%
* 2²: ~81%
* 2³: ~81.5%
* 2⁴: ~82%
* 2⁵: ~82%
* 2⁶: ~82.5%
* **PRM-Last-Sum (Green):** The line slopes upward, similar to Majority Vote, but starts slightly lower and ends slightly lower.
* 2⁰: ~80%
* 2¹: ~81%
* 2²: ~82.5%
* 2³: ~85%
* 2⁴: ~85.5%
* 2⁵: ~86%
* 2⁶: ~86%
* **PRM-Min-Max (Red):** The line shows an initial increase, then plateaus, and has some fluctuations.
* 2⁰: ~80%
* 2¹: ~80.5%
* 2²: ~81%
* 2³: ~82%
* 2⁴: ~82%
* 2⁵: ~82%
* 2⁶: ~82.5%
* **PRM-Min-Sum (Purple):** The line slopes upward, showing a consistent increase in accuracy with increasing generation rollouts. It starts lower than Majority Vote but reaches a similar level.
* 2⁰: ~80%
* 2¹: ~81%
* 2²: ~82.5%
* 2³: ~84.5%
* 2⁴: ~85.5%
* 2⁵: ~86%
* 2⁶: ~86%
### Key Observations
* **Majority Vote and PRM-Min-Sum** demonstrate the highest accuracy, reaching approximately 86-86.5% at 2⁶.
* **PRM-Last-Max, PRM-Min-Max** show the lowest and most stable accuracy, hovering around 82-82.5%.
* **PRM-Last-Sum** performs intermediately, with a steady increase but not reaching the levels of Majority Vote or PRM-Min-Sum.
* The most significant accuracy gains occur between 2⁰ and 2³, after which the improvements become marginal for most techniques.
### Interpretation
The data suggests that the "Majority Vote" and "PRM-Min-Sum" aggregation techniques are the most effective for improving accuracy as the number of generation rollouts increases. These techniques consistently outperform "PRM-Last-Max" and "PRM-Min-Max". The relatively flat performance of the latter two suggests they are less sensitive to the number of rollouts or may have reached a performance ceiling.
The initial rapid increase in accuracy across all techniques indicates that early generation rollouts provide the most significant improvements. Beyond a certain point (around 2³ or 2⁴), the marginal gains diminish, suggesting diminishing returns.
The difference between "PRM-Last-Sum" and the top performers ("Majority Vote" and "PRM-Min-Sum") could be due to the way the last responses are aggregated. The "Sum" approach might be more susceptible to outliers or less effective at capturing the consensus of multiple responses compared to the "Majority Vote" or "Min-Sum" approaches.
This data is valuable for optimizing the PRM process by informing the choice of aggregation technique and the optimal number of generation rollouts to balance accuracy and computational cost. Further investigation could explore why "Majority Vote" and "PRM-Min-Sum" are superior and whether the performance differences are statistically significant.