\n
## Diagram: Ionic Transport and Filament Formation
### Overview
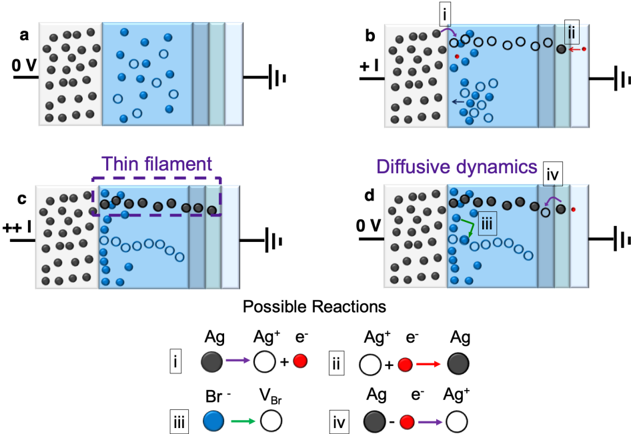
The image presents a schematic diagram illustrating ionic transport and the formation of a thin filament across a membrane-like structure, likely representing an electrochemical cell. Four panels (a-d) depict different stages or conditions, with associated reaction schemes below. The diagram uses visual cues like particle distribution and arrows to represent ion movement and chemical reactions.
### Components/Axes
The diagram consists of four panels labeled a, b, c, and d, arranged in a 2x2 grid. Each panel shows a partitioned space with a membrane-like structure separating two regions. Each region has a battery symbol indicating a potential difference. The panels also contain black and blue circles representing ions, and arrows indicating their movement. Below the panels is a section labeled "Possible Reactions" with four numbered reactions (i-iv) depicting chemical processes.
### Detailed Analysis or Content Details
**Panel a:**
* Voltage: 0V.
* Left side: High concentration of black circles (likely representing Ag+ ions).
* Right side: Scattered blue circles (likely representing Br- ions) and some empty circles.
* No apparent directed movement of ions.
**Panel b:**
* Voltage: +1.
* Left side: High concentration of black circles.
* Right side: Fewer black circles, more empty circles, and blue circles.
* Arrows:
* i: Black circle moving from left to right, labeled "Ag -> Ag+ + e-".
* ii: Empty circle moving from right to left, labeled "Ag+ + e- -> Ag".
* Arrows indicate ion transport across the membrane.
**Panel c:**
* Voltage: ++.
* Left side: High concentration of black circles.
* Right side: A purple line (representing a "Thin filament") is formed, connecting the two sides.
* Arrows:
* Purple line indicates the formation of a conductive path.
**Panel d:**
* Voltage: 0V.
* Left side: High concentration of black circles.
* Right side: Scattered blue circles and empty circles.
* Arrows:
* iii: Blue circle moving from right to left, labeled "Br -> VBr".
* iv: Black circle moving from left to right, labeled "Ag + e- -> Ag+".
**Possible Reactions:**
* i: Ag -> Ag+ + e- (Silver oxidation)
* ii: Ag+ + e- -> Ag (Silver reduction)
* iii: Br -> VBr (Bromine vacancy formation)
* iv: Ag + e- -> Ag+ (Silver oxidation)
### Key Observations
* The diagram illustrates the formation of a conductive filament (Panel c) under an applied voltage (Panel b).
* The reactions suggest a redox process involving silver ions (Ag and Ag+) and electron transfer.
* The presence of bromine (Br) and its vacancy (VBr) suggests an ionic conduction mechanism.
* The voltage changes influence the ion distribution and reaction pathways.
### Interpretation
The diagram depicts a process of ion migration and filament formation, likely related to resistive switching or memristive behavior in a solid electrolyte. The applied voltage drives the movement of silver ions (Ag+) and bromine ions (Br-), leading to the formation of a conductive filament composed of silver. The reactions show the oxidation and reduction of silver, coupled with the creation of bromine vacancies to facilitate ion transport. The diagram suggests that the filament formation is driven by electrochemical reactions and ion diffusion. The change in voltage from 0V to +1V and ++V is critical for initiating and sustaining the filament growth. The final state (Panel d) shows a return to a more dispersed state, potentially indicating a reset or switching process. The diagram is a simplified representation of a complex electrochemical process, but it effectively conveys the key mechanisms involved in filament formation and resistive switching.