## [Line Charts]: Performance Comparison of Linear vs. Refined Models Under Different Alignment Conditions
### Overview
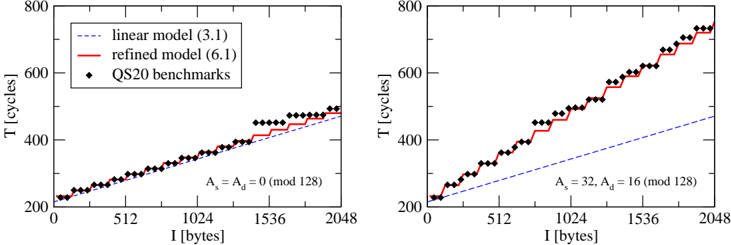
The image contains two side-by-side line charts comparing the performance (in CPU cycles) of a "linear model" and a "refined model" against actual "QS20 benchmarks" as a function of input size `I` in bytes. The charts illustrate how model accuracy changes under two different memory alignment conditions.
### Components/Axes
* **Chart Type:** Two 2D line plots with scatter points.
* **X-Axis (Both Charts):** Label: `I [bytes]`. Scale: Linear, from 0 to 2048. Major tick marks at 0, 512, 1024, 1536, 2048.
* **Y-Axis (Both Charts):** Label: `T [cycles]`. Scale: Linear, from 200 to 800. Major tick marks at 200, 400, 600, 800.
* **Legend (Located in top-left of the left chart, applies to both):**
* Blue dashed line: `linear model (3.1)`
* Red solid line: `refined model (6.1)`
* Black diamond marker: `QS20 benchmarks`
* **Chart-Specific Titles (Centered below each plot):**
* Left Chart: `A_s = A_d = 0 (mod 128)`
* Right Chart: `A_s = 32, A_d = 16 (mod 128)`
### Detailed Analysis
**Left Chart (`A_s = A_d = 0 (mod 128)`):**
* **Trend Verification:**
* **Linear Model (Blue Dashed):** Shows a steady, approximately linear upward trend from ~220 cycles at I=0 to ~480 cycles at I=2048.
* **Refined Model (Red Solid):** Exhibits a step-function pattern. It increases in discrete jumps, with plateaus between jumps. It closely follows the benchmark data.
* **QS20 Benchmarks (Black Diamonds):** Also follows a clear step-function pattern, very similar to the refined model.
* **Data Points & Values (Approximate):**
* At I=0: All series start near 220 cycles.
* First major plateau for benchmarks/refined model: ~300 cycles for I from ~256 to ~768.
* Second major plateau: ~400 cycles for I from ~1024 to ~1536.
* Final value at I=2048: Benchmarks and refined model are at ~500 cycles, while the linear model is slightly lower at ~480 cycles.
**Right Chart (`A_s = 32, A_d = 16 (mod 128)`):**
* **Trend Verification:**
* **Linear Model (Blue Dashed):** Shows a linear upward trend, but with a much shallower slope than in the left chart. It starts near 220 cycles and ends at approximately 460 cycles at I=2048.
* **Refined Model (Red Solid):** Shows a steeper, more continuous upward trend with smaller, more frequent steps compared to the left chart.
* **QS20 Benchmarks (Black Diamonds):** Follows a very similar steep, stepped upward trend as the refined model.
* **Data Points & Values (Approximate):**
* At I=0: All series start near 220 cycles.
* The refined model and benchmarks diverge significantly upward from the linear model early on.
* At I=1024: Benchmarks/refined model are at ~550 cycles, while the linear model is at ~350 cycles.
* Final value at I=2048: Benchmarks and refined model reach approximately 750 cycles, while the linear model is far lower at ~460 cycles.
### Key Observations
1. **Model Accuracy:** The "refined model (6.1)" is a significantly better predictor of the actual "QS20 benchmarks" than the "linear model (3.1)" in both alignment scenarios. The red line and black diamonds are nearly coincident.
2. **Impact of Alignment:** The alignment parameters (`A_s`, `A_d`) dramatically affect performance. The non-zero alignment condition (right chart) results in a much steeper increase in cycles (T) as input size (I) grows, compared to the zero-alignment condition (left chart).
3. **Step-Function Behavior:** The benchmark data exhibits a clear step-function characteristic, suggesting performance changes at specific input size thresholds (likely related to cache lines or memory block sizes of 128 bytes, as hinted by the `mod 128` in the titles).
4. **Linear Model Limitation:** The linear model fails to capture the step-function nature and, more critically, severely underestimates performance cost under the non-zero alignment condition (right chart).
### Interpretation
This data demonstrates the critical importance of modeling low-level hardware effects, such as memory alignment, when predicting computational performance. The "linear model" likely represents a simplified theoretical analysis that assumes uniform cost per byte. In contrast, the "refined model" incorporates the real-world, non-linear effects of memory access patterns, which are heavily influenced by alignment (`A_s`, `A_d`) and manifest as step-functions due to cache line boundaries (128-byte blocks).
The stark difference between the two charts shows that misaligned memory accesses (`A_s=32, A_d=16`) incur a much higher and more rapidly growing cycle cost as the data size increases. The refined model's ability to accurately track the benchmark data in both scenarios validates its underlying assumptions and makes it a reliable tool for performance estimation and optimization in systems where memory alignment is a factor. The charts argue that ignoring these effects (as the linear model does) leads to grossly inaccurate performance predictions.