## Line Graphs: Performance Comparison of Linear and Refined Models
### Overview
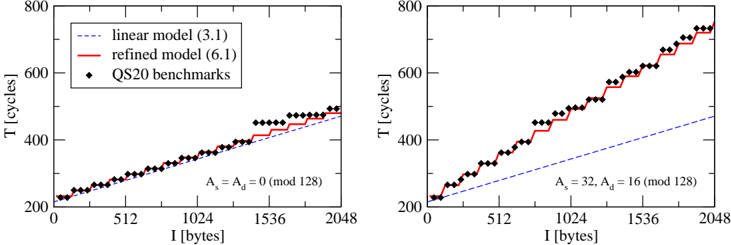
The image contains two side-by-side line graphs comparing the performance of two models ("linear model (3.1)" and "refined model (6.1)") against "QS20 benchmarks" across varying input sizes (I [bytes]). The graphs show time (T [cycles]) on the y-axis and input size (I [bytes]) on the x-axis. Each graph includes annotations for parameters A_s and A_d (mod 128).
### Components/Axes
- **X-axis**: "I [bytes]" (input size), ranging from 0 to 2048 bytes.
- **Y-axis**: "T [cycles]" (time in cycles), ranging from 200 to 800 cycles.
- **Legends**:
- Dashed blue line: "linear model (3.1)"
- Solid red line: "refined model (6.1)"
- Black diamond markers: "QS20 benchmarks"
- **Annotations**:
- Left graph: "A_s = A_d = 0 (mod 128)"
- Right graph: "A_s = 32, A_d = 16 (mod 128)"
### Detailed Analysis
#### Left Graph (A_s = A_d = 0 mod 128)
- **Linear Model (3.1)**: Dashed blue line shows a linear increase in T with I. At I = 2048 bytes, T ≈ 600 cycles.
- **Refined Model (6.1)**: Solid red line follows a similar trend but with slightly higher T values (e.g., ~620 cycles at I = 2048).
- **QS20 Benchmarks**: Black diamonds align closely with the refined model, suggesting the benchmarks are near the refined model's performance.
#### Right Graph (A_s = 32, A_d = 16 mod 128)
- **Linear Model (3.1)**: Dashed blue line shows a linear increase, reaching ~600 cycles at I = 2048.
- **Refined Model (6.1)**: Solid red line exhibits a steeper slope, reaching ~750 cycles at I = 2048.
- **QS20 Benchmarks**: Black diamonds align more closely with the refined model, indicating improved performance under these parameters.
### Key Observations
1. **Model Performance**: The refined model (6.1) consistently outperforms the linear model (3.1) in both graphs, with a more pronounced difference in the right graph (A_s = 32, A_d = 16).
2. **QS20 Benchmarks**: In the left graph, benchmarks are closer to the refined model, while in the right graph, they align almost perfectly with the refined model.
3. **Parameter Impact**: The right graph’s higher A_s and A_d values correlate with a steeper slope for the refined model, suggesting these parameters enhance performance.
### Interpretation
The data demonstrates that the refined model (6.1) is more efficient than the linear model (3.1), particularly when parameters A_s and A_d are non-zero. The QS20 benchmarks likely represent real-world or standardized performance metrics, and their alignment with the refined model in both graphs suggests it better matches practical requirements. The steeper slope in the right graph indicates that increasing A_s and A_d amplifies the refined model’s advantage, possibly due to optimized resource allocation or algorithmic improvements. This highlights the importance of parameter tuning in model design for computational efficiency.