# Technical Document: Coverage Comparison Across Methods and Models
## Image Description
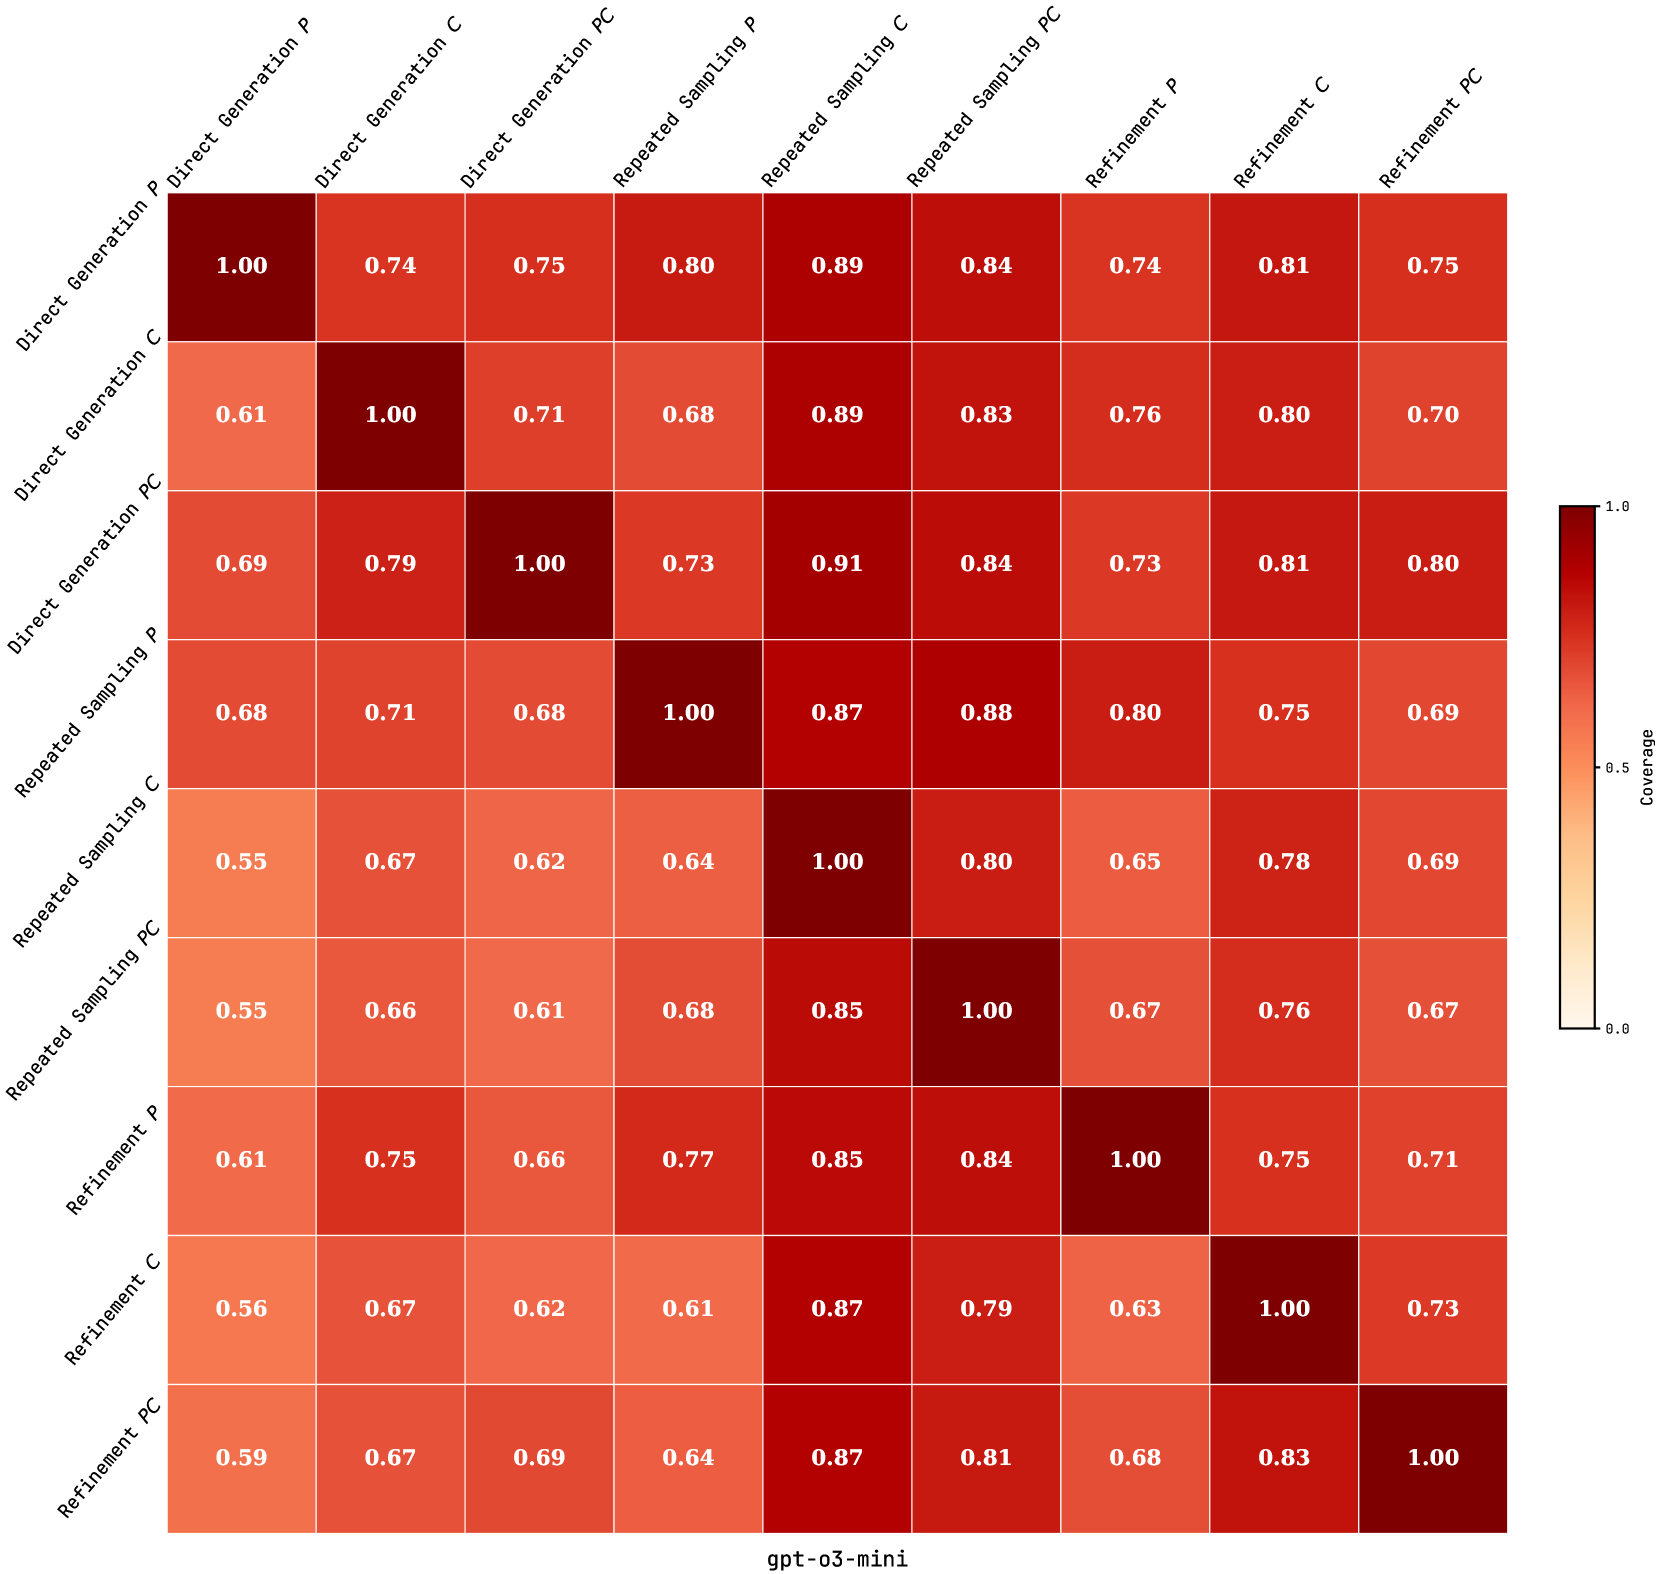
The image is a **heatmap** visualizing coverage values across different **methods** (rows) and **models** (columns). The color intensity corresponds to coverage values, with darker red indicating higher coverage (closer to 1.0) and lighter red indicating lower coverage (closer to 0.0). The legend on the right maps colors to numerical values.
---
## Key Components
### 1. **Axis Labels**
- **X-axis (Models)**:
`gpt-o3-mini`, `gpt-o3-medium`, `gpt-o3-large`
- **Y-axis (Methods)**:
`Direct Generation P`, `Direct Generation C`, `Direct Generation PC`,
`Repeated Sampling P`, `Repeated Sampling C`, `Repeated Sampling PC`,
`Refinement P`, `Refinement C`, `Refinement PC`
- **Title**: `Coverage Comparison Across Methods and Models`
### 2. **Legend**
- **Location**: Right side of the heatmap.
- **Color Scale**:
- `0.0` (lightest red) to `1.0` (darkest red).
- Intermediate values: `0.5`, `0.75`, `0.9`.
---
## Data Structure
The heatmap is a **9x3 matrix** (9 methods × 3 models). Each cell contains a numerical coverage value. Below is the reconstructed table:
| Method | gpt-o3-mini | gpt-o3-medium | gpt-o3-large |
|----------------------|-------------|---------------|--------------|
| Direct Generation P | 1.00 | 0.74 | 0.75 |
| Direct Generation C | 0.61 | 1.00 | 0.71 |
| Direct Generation PC | 0.69 | 0.79 | 1.00 |
| Repeated Sampling P | 0.68 | 0.71 | 0.68 |
| Repeated Sampling C | 0.55 | 0.67 | 0.62 |
| Repeated Sampling PC | 0.55 | 0.66 | 0.61 |
| Refinement P | 0.61 | 0.75 | 0.66 |
| Refinement C | 0.56 | 0.67 | 0.62 |
| Refinement PC | 0.59 | 0.67 | 0.69 |
---
## Trends and Observations
1. **Direct Generation P** consistently shows high coverage (1.00 for `gpt-o3-mini`, 0.74–0.89 for other models).
2. **Direct Generation C** and **PC** exhibit moderate coverage, with PC achieving 1.00 for `gpt-o3-large`.
3. **Repeated Sampling** methods generally have lower coverage (0.55–0.88), with `Repeated Sampling C` showing the lowest values.
4. **Refinement** methods demonstrate moderate-to-high coverage, with `Refinement PC` achieving 0.83 for `gpt-o3-large`.
5. **Color Consistency**:
- Dark red cells (e.g., 1.00) align with the legend's highest value.
- Lighter red cells (e.g., 0.55–0.62) match the legend's lower range.
---
## Spatial Grounding
- **Legend Position**: Right-aligned, vertically stacked.
- **X-axis Position**: Bottom of the heatmap.
- **Y-axis Position**: Left of the heatmap.
---
## Notes
- All values are in **English** and represent coverage percentages.
- No non-English text is present.
- The heatmap uses a **continuous color scale** without discrete categories.
This analysis confirms that the heatmap effectively compares coverage across methods and models, with `Direct Generation P` and `Refinement PC` showing the highest performance for `gpt-o3-large`.