## Line Chart: Accuracy vs. Training Epochs for Three Methods
### Overview
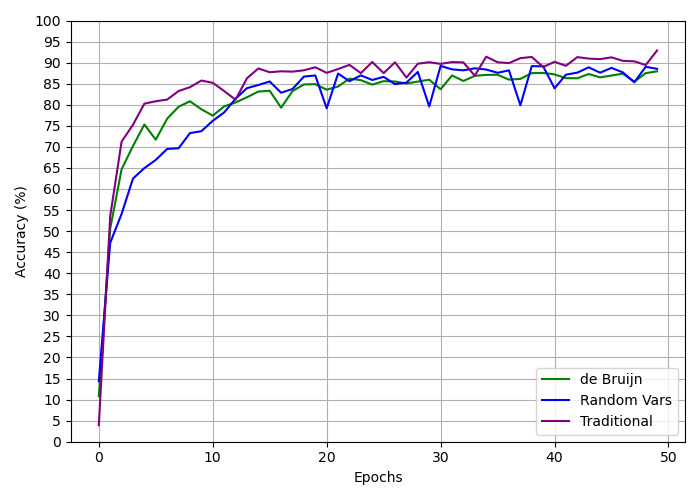
This image is a line chart comparing the training accuracy (in percentage) over 50 epochs for three distinct methods or models. The chart demonstrates the learning curves, showing how each method's performance improves and stabilizes over time.
### Components/Axes
* **Chart Type:** Line chart with grid lines.
* **X-Axis:** Labeled **"Epochs"**. It represents the number of training iterations, with major tick marks at 0, 10, 20, 30, 40, and 50.
* **Y-Axis:** Labeled **"Accuracy (%)"**. It represents the model's accuracy as a percentage, ranging from 0 to 100 with major tick marks every 5 units (0, 5, 10, ..., 95, 100).
* **Legend:** Located in the **bottom-right corner** of the chart area. It contains three entries:
* **Green line:** "de Bruijn"
* **Blue line:** "Random Vars"
* **Purple line:** "Traditional"
### Detailed Analysis
The chart plots three data series, each showing a general upward trend that plateaus, indicating learning. Below is an analysis of each series, including approximate data points and trend verification.
1. **Traditional (Purple Line):**
* **Trend:** This line shows the fastest initial rise and maintains the highest accuracy throughout. It has the smoothest curve with the least volatility after the initial ascent.
* **Approximate Data Points:**
* Epoch 0: ~5%
* Epoch 5: ~80%
* Epoch 10: ~85%
* Epoch 20: ~88%
* Epoch 30: ~90%
* Epoch 40: ~90%
* Epoch 50: ~93% (final point)
2. **de Bruijn (Green Line):**
* **Trend:** Rises quickly, though slightly slower than the Traditional method. It exhibits moderate volatility, with noticeable dips and recoveries, but generally stays within a band between 80% and 90% after epoch 15.
* **Approximate Data Points:**
* Epoch 0: ~10%
* Epoch 5: ~75%
* Epoch 10: ~80%
* Epoch 15: ~85% (local peak)
* Epoch 20: ~83% (dip)
* Epoch 30: ~87%
* Epoch 40: ~88%
* Epoch 50: ~89%
3. **Random Vars (Blue Line):**
* **Trend:** Shows the slowest initial learning rate. It is the most volatile series, characterized by sharp, periodic drops in accuracy followed by recoveries. Despite the volatility, its overall trend is upward, converging with the de Bruijn line in the later epochs.
* **Approximate Data Points:**
* Epoch 0: ~5%
* Epoch 5: ~65%
* Epoch 10: ~75%
* Epoch 20: ~85% (before a sharp dip)
* Epoch 25: ~80% (after a dip)
* Epoch 30: ~85%
* Epoch 35: ~80% (another dip)
* Epoch 40: ~88%
* Epoch 50: ~88%
### Key Observations
* **Performance Hierarchy:** The "Traditional" method consistently achieves the highest accuracy. The "de Bruijn" method is generally second, and the "Random Vars" method is third, though it catches up by the end.
* **Volatility:** The "Random Vars" line is highly unstable, with significant, recurring drops in accuracy (e.g., near epochs 20, 25, 35). The "de Bruijn" line shows moderate volatility. The "Traditional" line is the most stable.
* **Convergence:** By epoch 50, the accuracy of all three methods is within a relatively narrow range (approximately 88% to 93%), suggesting they may be approaching a similar performance ceiling for this task.
* **Initial Learning Phase:** All methods show their most rapid improvement within the first 10 epochs.
### Interpretation
This chart likely compares different initialization strategies, architectural components, or training methodologies for a machine learning model. The data suggests that the **"Traditional" approach is the most effective and stable** for this specific task, providing both fast learning and high final accuracy. The **"Random Vars" method appears to be a stochastic or less constrained approach**, leading to unstable training dynamics (the sharp dips may represent catastrophic forgetting or instability from random perturbations), though it eventually learns a competent representation. The **"de Bruijn" method offers a middle ground**, providing better stability than "Random Vars" but not reaching the peak performance of the "Traditional" method.
The key takeaway is that while all methods can learn the task, the choice of method significantly impacts training stability and final performance. The "Traditional" method is preferable for reliability, whereas the volatility of "Random Vars" might be undesirable in a production setting unless it offers other benefits (like exploration in reinforcement learning). The convergence of all lines suggests the task has a fundamental difficulty ceiling that all methods are approaching.