\n
## Line Chart: Per-Period Regret vs. Time Period
### Overview
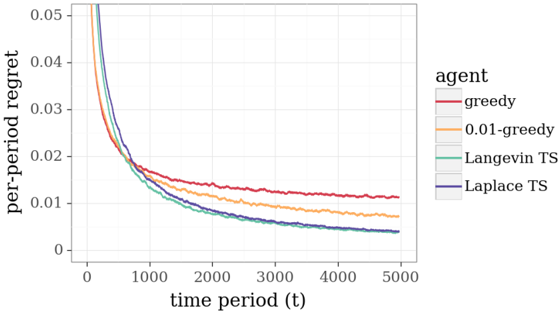
The image presents a line chart illustrating the per-period regret of different agents over time. The x-axis represents the time period (t), ranging from 0 to 5000, and the y-axis represents the per-period regret, ranging from 0 to 0.05. Four different agents are compared: greedy, 0.01-greedy, Langevin TS, and Laplace TS.
### Components/Axes
* **X-axis:** "time period (t)" - Scale ranges from approximately 0 to 5000.
* **Y-axis:** "per-period regret" - Scale ranges from approximately 0 to 0.05.
* **Legend:** Located in the top-right corner, labeling the lines as follows:
* "greedy" - Represented by a red line.
* "0.01-greedy" - Represented by an orange line.
* "Langevin TS" - Represented by a light green line.
* "Laplace TS" - Represented by a blue line.
### Detailed Analysis
* **Greedy (Red Line):** The line starts at approximately 0.048 at t=0 and decreases rapidly to around 0.012 at t=1000. It then plateaus, fluctuating between approximately 0.01 and 0.013 for the remainder of the time period, ending at approximately 0.011 at t=5000.
* **0.01-greedy (Orange Line):** The line begins at approximately 0.048 at t=0 and decreases more gradually than the "greedy" line, reaching around 0.011 at t=1000. It continues to decrease slowly, reaching approximately 0.008 at t=5000.
* **Langevin TS (Light Green Line):** This line starts at approximately 0.048 at t=0 and decreases rapidly to around 0.009 at t=1000. It continues to decrease, albeit at a slower rate, reaching approximately 0.006 at t=5000.
* **Laplace TS (Blue Line):** The line starts at approximately 0.048 at t=0 and decreases rapidly to around 0.007 at t=1000. It continues to decrease, reaching approximately 0.005 at t=5000.
All lines exhibit a decreasing trend, indicating that the per-period regret decreases as the time period increases. The initial drop is steep for all agents, but the rate of decrease slows down over time.
### Key Observations
* The "greedy" agent has the highest per-period regret for most of the time period, although it stabilizes at a relatively high level.
* The "0.01-greedy" agent consistently performs better than the "greedy" agent, with a lower per-period regret throughout.
* "Langevin TS" and "Laplace TS" agents exhibit the lowest per-period regret, with "Laplace TS" slightly outperforming "Langevin TS" towards the end of the time period.
* All agents converge towards a low level of per-period regret as time increases, suggesting that they all learn to minimize regret over time.
### Interpretation
The chart demonstrates the performance of different agents in a sequential decision-making scenario, where the goal is to minimize per-period regret. The results suggest that exploration strategies, such as those employed by "Langevin TS" and "Laplace TS", are more effective at reducing regret in the long run compared to purely greedy approaches. The "0.01-greedy" agent, which incorporates a small amount of exploration, also outperforms the "greedy" agent, indicating the benefit of some level of randomness in decision-making. The convergence of all agents towards a low level of regret suggests that they are all capable of learning from their experiences and improving their performance over time. The differences in performance highlight the trade-off between exploration and exploitation in reinforcement learning. The "greedy" agent exploits its current knowledge but may get stuck in suboptimal solutions, while the exploration-based agents are more likely to discover better solutions but may incur higher regret in the short term.