\n
## Diagram: LSTM Cell Structure
### Overview
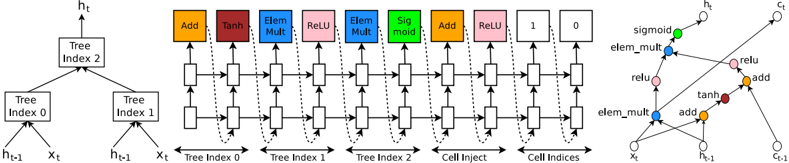
The image depicts the internal structure of a Long Short-Term Memory (LSTM) cell, a type of recurrent neural network (RNN) architecture. It shows the flow of information through various gates and operations within the cell. The diagram is split into three main sections: a tree-like representation of cell indices, a horizontal sequence of operations, and a zoomed-in view of a portion of the cell.
### Components/Axes
The diagram contains the following components:
* **Input:** `xₜ` (input at time t) and `hₜ₋₁` (hidden state at time t-1).
* **Gates/Operations:** Add, Tanh, Element-wise Multiplication (Elem Mult), ReLU, Sigmoid, Cell Inject.
* **Cell State:** Represented by horizontal lines flowing through the operations.
* **Output:** `hₜ` (hidden state at time t).
* **Tree Indices:** Tree Index 0, Tree Index 1, Tree Index 2.
* **Cell Indices:** Cell Inject, Cell Indices.
* **Labels:** Add, Tanh, Elem Mult, ReLU, Sigmoid, Add, 1, 0, sigmoid, relu, elem_mult, add, tanh.
### Detailed Analysis or Content Details
**Left Section (Tree Indices):**
This section shows a binary tree structure.
* The root node is labeled "Tree Index 2".
* It branches into "Tree Index 0" and "Tree Index 1".
* "Tree Index 0" receives inputs from `hₜ₋₁` and `xₜ`.
* "Tree Index 1" receives inputs from `hₜ₋₁` and `xₜ`.
* The output of the tree structure feeds into the main LSTM cell operations.
**Middle Section (LSTM Cell Operations):**
This section shows a sequence of operations applied to the cell state. The operations are arranged horizontally.
1. **Add:** Receives input from Tree Index 0 and the cell state. Output is colored red.
2. **Tanh:** Receives input from the previous Add operation. Output is colored red.
3. **Elem Mult:** Receives input from Tree Index 1 and the previous Tanh operation. Output is colored blue.
4. **ReLU:** Receives input from the previous Elem Mult operation. Output is colored blue.
5. **Elem Mult:** Receives input from Tree Index 2 and the previous ReLU operation. Output is colored green.
6. **Sigmoid:** Receives input from the previous Elem Mult operation. Output is colored green.
7. **Add:** Receives input from the previous Sigmoid operation and the cell state. Output is colored orange.
8. **1:** A constant value of 1.
9. **0:** A constant value of 0.
**Right Section (Zoomed-in View):**
This section provides a more detailed view of a portion of the LSTM cell.
* `xₜ` and `hₜ₋₁` are inputs.
* The operations shown are: elem_mult, relu, add, tanh, add, sigmoid.
* The output is `hₜ`.
### Key Observations
* The LSTM cell utilizes multiple gates (Tanh, Sigmoid) and element-wise multiplications to control the flow of information.
* The tree structure on the left appears to represent a hierarchical decomposition of the cell state updates.
* The ReLU activation function is used to introduce non-linearity.
* The constant values 1 and 0 likely represent gating mechanisms.
### Interpretation
The diagram illustrates the complex internal workings of an LSTM cell. The tree structure suggests a way to organize and process information within the cell, potentially allowing for more efficient learning of long-term dependencies. The various gates and operations work together to regulate the flow of information, enabling the LSTM cell to selectively remember or forget information from previous time steps. The use of element-wise multiplication and non-linear activation functions (Tanh, ReLU, Sigmoid) allows the cell to learn complex patterns in the input data. The diagram highlights the key components and their interactions, providing a visual representation of the LSTM cell's functionality. The zoomed-in view emphasizes the specific operations involved in updating the hidden state. The diagram is a simplified representation of the LSTM cell, focusing on the core computational steps. It does not show the weight matrices or biases associated with each operation.