## Line Chart: Response Time vs. Amount by Entropy Level
### Overview
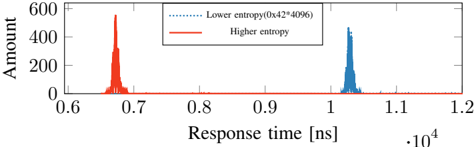
The chart compares response times (in nanoseconds) and associated amounts for two entropy levels: "Lower entropy (0x42*4096)" and "Higher entropy." Two data series are plotted: a red dotted line for lower entropy and a solid red line for higher entropy. The x-axis spans 0.6×10⁴ to 1.2×10⁴ ns, while the y-axis ranges from 0 to 600.
### Components/Axes
- **X-axis**: "Response time [ns]" with logarithmic scale markers at 0.6×10⁴, 0.7×10⁴, 0.8×10⁴, 0.9×10⁴, 1.0×10⁴, 1.1×10⁴, and 1.2×10⁴ ns.
- **Y-axis**: "Amount" with linear scale markers at 0, 200, 400, and 600.
- **Legend**: Located in the top-left corner, associating:
- Red dotted line → "Lower entropy (0x42*4096)"
- Solid red line → "Higher entropy"
### Detailed Analysis
- **Lower entropy (red dotted line)**:
- Peaks at **0.7×10⁴ ns** with an amount of **~400**.
- No other visible data points; the line drops sharply after the peak.
- **Higher entropy (solid red line)**:
- Peaks at **1.1×10⁴ ns** with an amount of **~200**.
- No other visible data points; the line drops sharply after the peak.
### Key Observations
1. Lower entropy exhibits a significantly shorter response time (0.7×10⁴ ns vs. 1.1×10⁴ ns) but a higher amount (~400 vs. ~200).
2. Both data series show abrupt drops after their respective peaks, suggesting no sustained activity beyond these points.
3. The logarithmic x-axis emphasizes differences in response time magnitudes.
### Interpretation
The data suggests an inverse relationship between entropy and response time: lower entropy processes achieve faster response times but require higher resource allocation (amount). Higher entropy processes, while slower, utilize fewer resources. The absence of data beyond the peaks implies these are isolated events or thresholds. The logarithmic x-axis highlights the exponential scale of response time differences, which may reflect computational complexity or system constraints. The chart does not provide granular data for intermediate values, limiting insights into gradual trends.