## Chart: Accuracy vs. Thinking Compute
### Overview
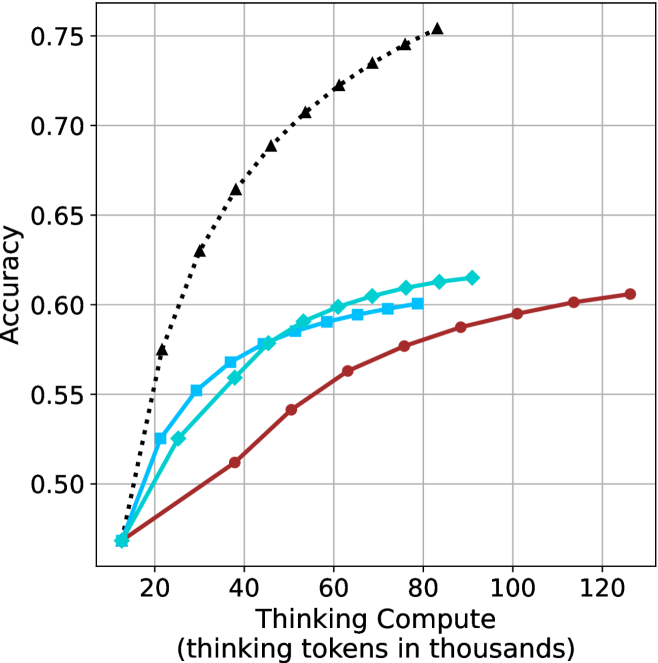
The image is a line chart comparing the accuracy of different models as a function of "Thinking Compute" (measured in thousands of tokens). There are three data series represented by different colored lines with distinct markers: black triangles (dotted line), cyan diamonds (solid line), and brown circles (solid line). The chart shows how accuracy increases with increasing compute for each model.
### Components/Axes
* **X-axis:** "Thinking Compute (thinking tokens in thousands)". The axis ranges from approximately 15 to 125, with tick marks at intervals of 20.
* **Y-axis:** "Accuracy". The axis ranges from 0.50 to 0.75, with tick marks at intervals of 0.05.
* **Data Series:**
* Black dotted line with triangle markers.
* Cyan solid line with diamond markers.
* Brown solid line with circle markers.
* **Grid:** The chart has a grid with vertical and horizontal lines at each tick mark on the axes.
### Detailed Analysis
* **Black (Triangle Markers, Dotted Line):** This line shows the highest accuracy for a given compute value. The line increases rapidly from approximately (15, 0.47) to (30, 0.66), then continues to increase, but at a slower rate, reaching approximately (80, 0.75).
* **Cyan (Diamond Markers, Solid Line):** This line starts at approximately (15, 0.47), increases to approximately (60, 0.60), and then plateaus, reaching approximately (80, 0.62).
* **Brown (Circle Markers, Solid Line):** This line starts at approximately (15, 0.47), increases more slowly than the other two lines, reaching approximately (125, 0.61).
### Key Observations
* The black dotted line (triangle markers) consistently outperforms the other two models in terms of accuracy for a given amount of thinking compute.
* The cyan line (diamond markers) initially performs similarly to the black line but plateaus at a lower accuracy.
* The brown line (circle markers) shows the slowest increase in accuracy with increasing compute.
### Interpretation
The chart suggests that the model represented by the black dotted line (triangle markers) is the most efficient in terms of accuracy gained per unit of thinking compute. The other two models, represented by the cyan and brown lines, show diminishing returns in accuracy as compute increases, with the brown line being the least efficient. The data demonstrates the relationship between computational resources and model performance, highlighting the importance of choosing an efficient model architecture. The black line's rapid initial increase suggests it quickly learns from the initial tokens, while the other models require more compute to achieve comparable accuracy.