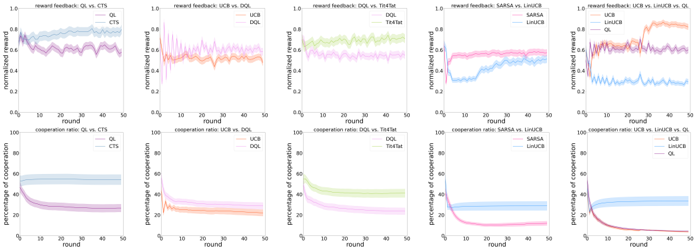
## Chart Type: Multiple Line Graphs
### Overview
The image presents ten line graphs arranged in two rows of five. The top row displays "reward feedback" as a function of "round" for different algorithm comparisons. The bottom row shows the "cooperation ratio" as a function of "round" for the same algorithm comparisons. Each graph plots the performance of two or three algorithms over 50 rounds, with shaded regions indicating uncertainty or variance.
### Components/Axes
**General Axes:**
* **x-axis:** "round", ranging from 0 to 50 in increments of 10.
* **y-axis (top row):** "normalized reward", ranging from 0.0 to 1.0 in increments of 0.2.
* **y-axis (bottom row):** "percentage of cooperation", ranging from 0 to 100 in increments of 20.
**Specific Graph Details (Top Row - Reward Feedback):**
1. **Graph 1:** "reward feedback: QL vs. CTS"
* QL (light blue): Starts around 0.8, fluctuates, and stabilizes around 0.75.
* CTS (purple): Starts around 0.85, fluctuates, and stabilizes around 0.75.
2. **Graph 2:** "reward feedback: UCB vs. DQL"
* UCB (pink): Starts around 0.1, increases rapidly, and stabilizes around 0.7.
* DQL (orange): Starts around 0.1, increases rapidly, and stabilizes around 0.7.
3. **Graph 3:** "reward feedback: DQL vs. Tit4Tat"
* DQL (light green): Starts around 0.6, fluctuates slightly around 0.7.
* Tit4Tat (light orange): Starts around 0.6, fluctuates slightly around 0.7.
4. **Graph 4:** "reward feedback: SARSA vs. LinUCB"
* SARSA (pink): Starts around 0.4, increases to around 0.6.
* LinUCB (light blue): Starts around 0.3, increases to around 0.6.
5. **Graph 5:** "reward feedback: UCB vs. LinUCB vs. QL"
* UCB (orange): Starts around 0.4, increases to around 0.8.
* LinUCB (purple): Starts around 0.4, increases to around 0.7.
* QL (light blue): Starts around 0.2, fluctuates around 0.3.
**Specific Graph Details (Bottom Row - Cooperation Ratio):**
1. **Graph 1:** "cooperation ratio: QL vs. CTS"
* QL (light blue): Starts around 60, remains relatively stable.
* CTS (purple): Starts around 50, decreases to around 30.
2. **Graph 2:** "cooperation ratio: UCB vs. DQL"
* UCB (pink): Starts around 20, remains relatively stable.
* DQL (orange): Starts around 30, decreases to around 20.
3. **Graph 3:** "cooperation ratio: DQL vs. Tit4Tat"
* DQL (light green): Starts around 50, decreases to around 20.
* Tit4Tat (light orange): Starts around 50, decreases to around 20.
4. **Graph 4:** "cooperation ratio: SARSA vs. LinUCB"
* SARSA (pink): Starts around 50, decreases to around 10.
* LinUCB (light blue): Starts around 40, decreases to around 30.
5. **Graph 5:** "cooperation ratio: UCB vs. LinUCB vs. QL"
* UCB (orange): Starts around 40, decreases to around 10.
* LinUCB (purple): Starts around 40, decreases to around 10.
* QL (light blue): Starts around 40, remains relatively stable around 30.
### Detailed Analysis
**Reward Feedback (Top Row):**
* **QL vs. CTS:** Both algorithms perform similarly, with slight fluctuations around a normalized reward of 0.75.
* **UCB vs. DQL:** Both algorithms show a rapid increase in normalized reward, stabilizing around 0.7.
* **DQL vs. Tit4Tat:** Both algorithms maintain a relatively stable normalized reward around 0.7.
* **SARSA vs. LinUCB:** Both algorithms show an increase in normalized reward, reaching around 0.6.
* **UCB vs. LinUCB vs. QL:** UCB and LinUCB outperform QL, reaching higher normalized reward values.
**Cooperation Ratio (Bottom Row):**
* **QL vs. CTS:** QL maintains a higher and more stable cooperation ratio compared to CTS, which decreases over time.
* **UCB vs. DQL:** Both algorithms have relatively low and stable cooperation ratios.
* **DQL vs. Tit4Tat:** Both algorithms show a decrease in cooperation ratio over time.
* **SARSA vs. LinUCB:** Both algorithms show a decrease in cooperation ratio over time, with SARSA decreasing more sharply.
* **UCB vs. LinUCB vs. QL:** UCB and LinUCB show a decrease in cooperation ratio, while QL maintains a more stable ratio.
### Key Observations
* **Reward Feedback:** UCB and DQL algorithms tend to achieve higher normalized rewards compared to QL in some scenarios.
* **Cooperation Ratio:** QL tends to maintain a more stable cooperation ratio compared to other algorithms, which often decrease over time.
* **SARSA and LinUCB:** These algorithms show similar trends in both reward feedback and cooperation ratio.
* **Tit4Tat:** Performs similarly to DQL in both reward feedback and cooperation ratio.
### Interpretation
The graphs compare the performance of different reinforcement learning algorithms in terms of reward feedback and cooperation ratio over a series of rounds. The data suggests that the choice of algorithm can significantly impact both the achieved reward and the level of cooperation. QL appears to be more stable in maintaining cooperation, while UCB and DQL may achieve higher rewards in certain scenarios. The decreasing cooperation ratios for many algorithms suggest a potential trade-off between maximizing reward and maintaining cooperative behavior. The shaded regions indicate the variability in performance, highlighting the importance of considering the robustness of each algorithm.