## Diagram: Global Fan-Out and Beta Reduction
### Overview
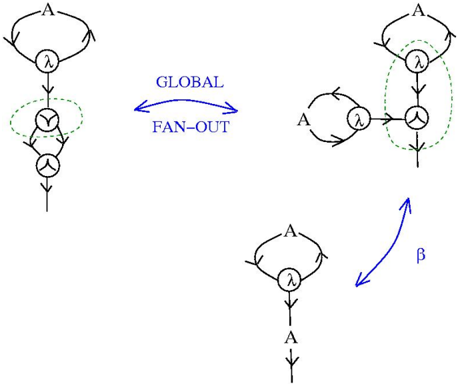
The image presents a diagram illustrating transformations between different configurations of a network or graph. It shows a "Global Fan-Out" transformation between two network structures and a "Beta Reduction" transformation to a simplified structure. The diagram uses nodes, edges with arrows indicating direction, and annotations to represent these transformations.
### Components/Axes
* **Nodes:** Represented by circles and a "Y" shaped symbol. Some circles contain the symbol "λ".
* **Edges:** Represented by lines with arrows, indicating the direction of flow or connection.
* **Annotations:**
* "A": Appears near circular loops.
* "λ": Appears inside some circular nodes.
* "GLOBAL": Blue text above a double-headed arrow.
* "FAN-OUT": Blue text below a double-headed arrow.
* "β": Blue text near a curved arrow.
* **Green Dashed Ovals:** Enclose specific regions of the network to highlight parts of the transformation.
### Detailed Analysis or ### Content Details
**Left Structure:**
* A vertical chain of nodes.
* Top node: A circle containing "λ" with a loop labeled "A" above it. An arrow points from the loop to the node. An arrow points down from the node.
* Middle section: Two "Y" shaped nodes stacked vertically, enclosed by a green dashed oval. Arrows point from the top node to the top "Y" node, and from the top "Y" node to the bottom "Y" node.
* Bottom: An arrow points down from the bottom "Y" node.
**Right Structure (Top):**
* Two separate structures connected.
* Left structure: A circle containing "λ" with a loop labeled "A" above it. An arrow points from the loop to the node.
* Right structure: A circle containing "λ" with a loop labeled "A" above it. An arrow points from the loop to the node. An arrow points down from the node.
* The two structures are connected by an arrow from the left structure to a "Y" shaped node. The "Y" shaped node is connected to the right structure. The "Y" shaped node and the right structure's "λ" node are enclosed by a green dashed oval.
* An arrow points down from the "Y" shaped node.
**Bottom Structure:**
* A vertical chain of nodes.
* Top node: A circle containing "λ" with a loop labeled "A" above it. An arrow points from the loop to the node. An arrow points down from the node.
* Bottom: An arrow labeled "A" points down from the node.
**Transformations:**
* **GLOBAL FAN-OUT:** A double-headed arrow between the left and right structures, labeled "GLOBAL" above and "FAN-OUT" below.
* **β Reduction:** A curved arrow from the right structure to the bottom structure, labeled "β".
### Key Observations
* The "GLOBAL FAN-OUT" transformation rearranges the network structure, duplicating a portion of the graph.
* The "β Reduction" transformation simplifies the network structure.
* The green dashed ovals highlight the parts of the network that are being transformed.
### Interpretation
The diagram illustrates two fundamental transformations in a network or graph. The "GLOBAL FAN-OUT" transformation represents a duplication or branching of a part of the network, potentially increasing its complexity or redundancy. The "β Reduction" transformation represents a simplification or reduction of the network, potentially optimizing its performance or reducing its complexity. The "β Reduction" is applied after the "GLOBAL FAN-OUT". The diagram suggests a process of network manipulation involving both expansion and simplification steps. The "λ" symbol likely represents a specific type of node or function within the network, and the "A" label likely represents a specific type of connection or attribute.