## Diagram: Process Flow with Feedback Loop
### Overview
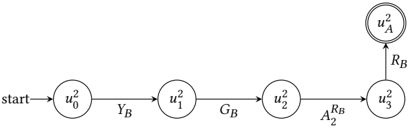
The image depicts a sequential process flow with a feedback mechanism. It begins at a "start" node and progresses through four stages labeled \( u^2_0 \), \( u^2_1 \), \( u^2_2 \), and \( u^2_3 \). A feedback loop connects \( u^2_3 \) back to an earlier stage \( u^2_A \), creating a cyclical component.
### Components/Axes
- **Nodes**:
- `start`: Initial node.
- \( u^2_0 \): First stage.
- \( u^2_1 \): Second stage.
- \( u^2_2 \): Third stage.
- \( u^2_3 \): Fourth stage.
- \( u^2_A \): Feedback target node.
- **Arrows/Transitions**:
- `Y_B`: Transition from \( u^2_0 \) to \( u^2_1 \).
- `G_B`: Transition from \( u^2_1 \) to \( u^2_2 \).
- `A_RB`: Transition from \( u^2_2 \) to \( u^2_3 \).
- `R_B`: Feedback arrow from \( u^2_3 \) to \( u^2_A \).
### Detailed Analysis
- **Flow Direction**:
- The process starts at `start` and moves linearly through \( u^2_0 \rightarrow u^2_1 \rightarrow u^2_2 \rightarrow u^2_3 \).
- A feedback loop (`R_B`) connects \( u^2_3 \) back to \( u^2_A \), suggesting iterative refinement or correction.
- **Labels**:
- All nodes use superscript notation (e.g., \( u^2_0 \)), possibly indicating squared values or a specific mathematical property.
- Arrow labels (`Y_B`, `G_B`, `A_RB`, `R_B`) likely represent variables, functions, or operations governing transitions.
### Key Observations
- The feedback loop (`R_B`) introduces cyclicality, implying the process may repeat or adjust based on \( u^2_3 \)'s output.
- No numerical values or quantitative data are present; the diagram focuses on structural relationships.
### Interpretation
This diagram likely represents a system with sequential stages and iterative feedback. The use of \( u^2 \) notation suggests mathematical or computational relevance, such as squared error terms, energy states, or algorithmic steps. The feedback loop (`R_B`) indicates that the final output (\( u^2_3 \)) influences an earlier stage (\( u^2_A \)), enabling corrections or optimizations. The labels (`Y_B`, `G_B`, `A_RB`) may correspond to system parameters, constraints, or transformation rules governing transitions between stages.
No numerical trends or outliers are observable due to the absence of quantitative data. The diagram emphasizes process structure over measurable outcomes.