## Line Graph: Accuracy vs. Input Size for Different r Values
### Overview
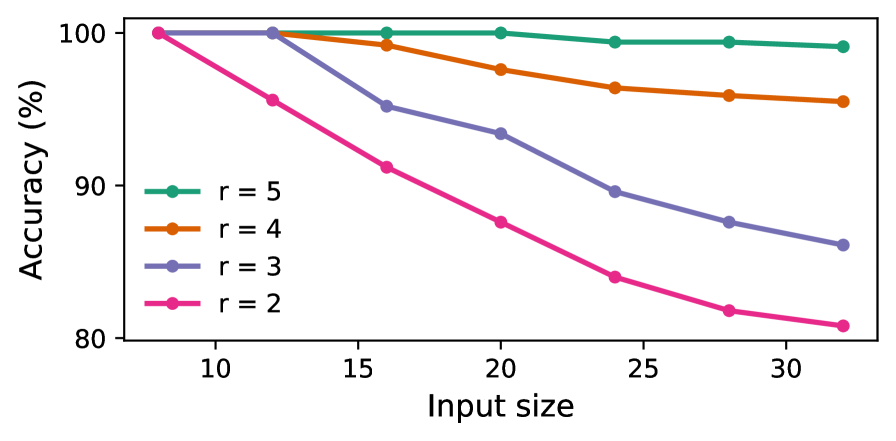
The graph illustrates the relationship between input size (x-axis) and accuracy percentage (y-axis) for four distinct values of parameter `r` (2, 3, 4, 5). Accuracy declines as input size increases, with higher `r` values maintaining higher accuracy across all input sizes.
### Components/Axes
- **X-axis (Input size)**: Ranges from 10 to 30 in increments of 5.
- **Y-axis (Accuracy %)**: Ranges from 80% to 100%.
- **Legend**: Located on the left, with four entries:
- `r = 5` (teal line)
- `r = 4` (orange line)
- `r = 3` (purple line)
- `r = 2` (pink line)
### Detailed Analysis
1. **r = 5 (teal line)**:
- Starts at 100% accuracy at input size 10.
- Remains nearly flat, dropping slightly to ~99.5% at input size 30.
- **Trend**: Minimal decline, indicating high stability.
2. **r = 4 (orange line)**:
- Begins at 100% accuracy at input size 10.
- Declines gradually to ~95% at input size 30.
- **Trend**: Moderate decline, less steep than lower `r` values.
3. **r = 3 (purple line)**:
- Starts at 100% accuracy at input size 10.
- Drops sharply to ~85% at input size 30.
- **Trend**: Steeper decline compared to higher `r` values.
4. **r = 2 (pink line)**:
- Begins at 100% accuracy at input size 10.
- Declines most steeply, reaching ~80% at input size 30.
- **Trend**: Sharpest decline, indicating sensitivity to input size.
### Key Observations
- **Inverse relationship**: Accuracy decreases as input size increases for all `r` values.
- **r-dependent performance**: Higher `r` values (5, 4) maintain higher accuracy, while lower `r` values (2, 3) degrade faster.
- **Threshold behavior**: At input size 10, all `r` values achieve 100% accuracy, suggesting a baseline performance limit.
### Interpretation
The graph demonstrates that parameter `r` significantly influences model robustness to input size. Higher `r` values (e.g., 5) exhibit near-constant accuracy, suggesting they are better suited for large-scale inputs. Lower `r` values (e.g., 2) show rapid performance degradation, implying they may be less efficient or require smaller input sizes for optimal results. This trend could inform parameter tuning strategies for systems handling variable input sizes, prioritizing higher `r` values for scalability.