## Bar and Line Charts: Performance Metrics vs. KV Budget
### Overview
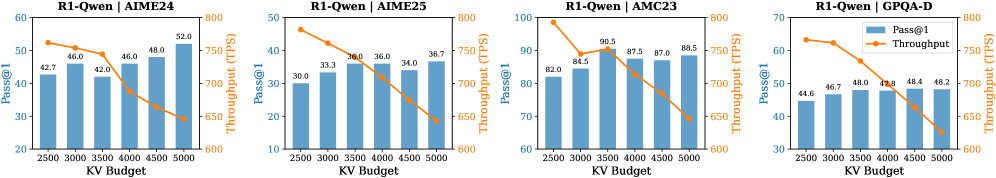
The image contains four bar and line charts, each displaying the performance of "R1-Qwen" on different datasets (AIME24, AIME25, AMC23, and GPQA-D). Each chart plots "Pass@1" (a performance metric) as blue bars and "Throughput (TPS)" as an orange line, both against "KV Budget" on the x-axis.
### Components/Axes
* **Titles (Top of each chart):**
* Chart 1: "R1-Qwen | AIME24"
* Chart 2: "R1-Qwen | AIME25"
* Chart 3: "R1-Qwen | AMC23"
* Chart 4: "R1-Qwen | GPQA-D"
* **X-Axis:** "KV Budget" with markers at 2500, 3000, 3500, 4000, 4500, and 5000.
* **Left Y-Axis:** "Pass@1"
* Chart 1: Scale from 20 to 60
* Chart 2: Scale from 10 to 50
* Chart 3: Scale from 60 to 100
* Chart 4: Scale from 30 to 70
* **Right Y-Axis:** "Throughput (TPS)" with a scale from 600 to 800 on all charts.
* **Legend (Top-Right of the last chart):**
* Blue: "Pass@1"
* Orange: "Throughput"
### Detailed Analysis
**Chart 1: R1-Qwen | AIME24**
* **Pass@1 (Blue Bars):** Generally increasing with KV Budget.
* KV Budget 2500: Pass@1 ≈ 42.7
* KV Budget 3000: Pass@1 ≈ 46.0
* KV Budget 3500: Pass@1 ≈ 42.0
* KV Budget 4000: Pass@1 ≈ 46.0
* KV Budget 4500: Pass@1 ≈ 48.0
* KV Budget 5000: Pass@1 ≈ 52.0
* **Throughput (Orange Line):** Decreasing with KV Budget.
* KV Budget 2500: Throughput ≈ 780 TPS
* KV Budget 3000: Throughput ≈ 760 TPS
* KV Budget 3500: Throughput ≈ 750 TPS
* KV Budget 4000: Throughput ≈ 670 TPS
* KV Budget 4500: Throughput ≈ 650 TPS
* KV Budget 5000: Throughput ≈ 630 TPS
**Chart 2: R1-Qwen | AIME25**
* **Pass@1 (Blue Bars):** Generally increasing with KV Budget.
* KV Budget 2500: Pass@1 ≈ 30.0
* KV Budget 3000: Pass@1 ≈ 33.3
* KV Budget 3500: Pass@1 ≈ 36.0
* KV Budget 4000: Pass@1 ≈ 36.0
* KV Budget 4500: Pass@1 ≈ 34.0
* KV Budget 5000: Pass@1 ≈ 36.7
* **Throughput (Orange Line):** Decreasing with KV Budget.
* KV Budget 2500: Throughput ≈ 780 TPS
* KV Budget 3000: Throughput ≈ 760 TPS
* KV Budget 3500: Throughput ≈ 730 TPS
* KV Budget 4000: Throughput ≈ 690 TPS
* KV Budget 4500: Throughput ≈ 670 TPS
* KV Budget 5000: Throughput ≈ 650 TPS
**Chart 3: R1-Qwen | AMC23**
* **Pass@1 (Blue Bars):** Generally increasing with KV Budget.
* KV Budget 2500: Pass@1 ≈ 82.0
* KV Budget 3000: Pass@1 ≈ 84.5
* KV Budget 3500: Pass@1 ≈ 90.5
* KV Budget 4000: Pass@1 ≈ 87.5
* KV Budget 4500: Pass@1 ≈ 87.0
* KV Budget 5000: Pass@1 ≈ 88.5
* **Throughput (Orange Line):** Decreasing with KV Budget.
* KV Budget 2500: Throughput ≈ 785 TPS
* KV Budget 3000: Throughput ≈ 730 TPS
* KV Budget 3500: Throughput ≈ 760 TPS
* KV Budget 4000: Throughput ≈ 700 TPS
* KV Budget 4500: Throughput ≈ 680 TPS
* KV Budget 5000: Throughput ≈ 650 TPS
**Chart 4: R1-Qwen | GPQA-D**
* **Pass@1 (Blue Bars):** Relatively stable with KV Budget.
* KV Budget 2500: Pass@1 ≈ 44.6
* KV Budget 3000: Pass@1 ≈ 46.7
* KV Budget 3500: Pass@1 ≈ 48.0
* KV Budget 4000: Pass@1 ≈ 47.8
* KV Budget 4500: Pass@1 ≈ 48.4
* KV Budget 5000: Pass@1 ≈ 48.2
* **Throughput (Orange Line):** Decreasing with KV Budget.
* KV Budget 2500: Throughput ≈ 775 TPS
* KV Budget 3000: Throughput ≈ 740 TPS
* KV Budget 3500: Throughput ≈ 710 TPS
* KV Budget 4000: Throughput ≈ 680 TPS
* KV Budget 4500: Throughput ≈ 660 TPS
* KV Budget 5000: Throughput ≈ 630 TPS
### Key Observations
* Across all datasets, "Pass@1" generally increases or remains stable with increasing "KV Budget."
* Across all datasets, "Throughput (TPS)" consistently decreases with increasing "KV Budget."
* The "AMC23" dataset shows the highest "Pass@1" values compared to the other datasets.
### Interpretation
The charts suggest a trade-off between "Pass@1" and "Throughput (TPS)" for the "R1-Qwen" model. Increasing the "KV Budget" tends to improve the "Pass@1" metric, indicating better accuracy or performance on the given task. However, this comes at the cost of reduced "Throughput (TPS)," suggesting a decrease in processing speed or efficiency. The optimal "KV Budget" would depend on the specific application and the relative importance of accuracy versus speed. The different performance characteristics across datasets (AIME24, AIME25, AMC23, GPQA-D) indicate that the model's behavior is influenced by the nature of the data it is processing.