## Multi-Chart Performance Analysis: R1-Qwen Model Across Four Datasets
### Overview
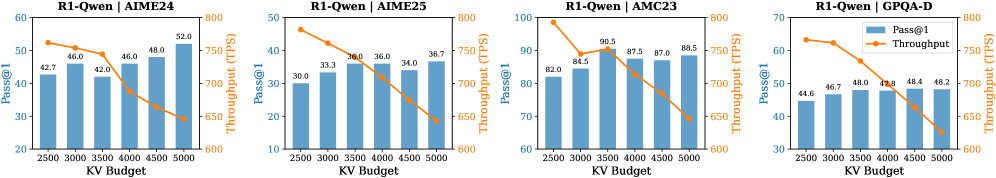
The image displays a set of four horizontally arranged bar-and-line combination charts. Each chart analyzes the performance of the "R1-Qwen" model on a different benchmark dataset (AIME24, AIME25, AMC23, GPQA-D) as a function of "KV Budget." The charts consistently show two metrics: **Pass@1** (represented by blue bars, left y-axis) and **Throughput** in Tokens Per Second (TPS, represented by an orange line, right y-axis).
### Components/Axes
* **Titles:** Each subplot has a title at the top center: "R1-Qwen | AIME24", "R1-Qwen | AIME25", "R1-Qwen | AMC23", "R1-Qwen | GPQA-D".
* **X-Axis (Common):** Labeled "KV Budget". The axis markers are at 2500, 3000, 3500, 4000, 4500, and 5000.
* **Primary Y-Axis (Left):** Labeled "Pass@1". The scale varies per chart to fit the data range.
* **Secondary Y-Axis (Right):** Labeled "Throughput (TPS)". The scale is consistent across all charts, ranging from 600 to 800 TPS.
* **Legend:** Located in the top-right corner of the fourth chart (GPQA-D). It defines:
* Blue Bar: "Pass@1"
* Orange Line with circular markers: "Throughput"
### Detailed Analysis
**Chart 1: R1-Qwen | AIME24**
* **Pass@1 (Blue Bars):** Shows a general upward trend with increasing KV Budget. Values are approximately: 42.7 (2500), 46.0 (3000), 42.0 (3500), 46.0 (4000), 48.0 (4500), 52.0 (5000). There is a notable dip at 3500.
* **Throughput (Orange Line):** Shows a clear downward trend. Starts at ~750 TPS at 2500 KV Budget and declines steadily to ~650 TPS at 5000 KV Budget.
**Chart 2: R1-Qwen | AIME25**
* **Pass@1 (Blue Bars):** Shows a consistent upward trend. Values are approximately: 30.0 (2500), 33.3 (3000), 34.0 (3500), 36.0 (4000), 34.0 (4500), 36.7 (5000). A slight dip occurs at 4500.
* **Throughput (Orange Line):** Shows a consistent downward trend. Starts at ~770 TPS at 2500 KV Budget and declines to ~640 TPS at 5000 KV Budget.
**Chart 3: R1-Qwen | AMC23**
* **Pass@1 (Blue Bars):** Shows a strong upward trend. Values are approximately: 82.0 (2500), 84.5 (3000), 90.5 (3500), 87.5 (4000), 87.0 (4500), 88.5 (5000). The peak is at 3500.
* **Throughput (Orange Line):** Shows a consistent downward trend. Starts at ~790 TPS at 2500 KV Budget and declines to ~640 TPS at 5000 KV Budget.
**Chart 4: R1-Qwen | GPQA-D**
* **Pass@1 (Blue Bars):** Shows a very gradual upward trend. Values are approximately: 44.6 (2500), 46.7 (3000), 48.0 (3500), 48.0 (4000), 48.4 (4500), 48.2 (5000). Performance plateaus after 3500.
* **Throughput (Orange Line):** Shows a consistent downward trend. Starts at ~750 TPS at 2500 KV Budget and declines to ~630 TPS at 5000 KV Budget.
### Key Observations
1. **Universal Trade-off:** Across all four datasets, there is a clear and consistent inverse relationship between **Pass@1** and **Throughput** as the KV Budget increases. Higher KV Budget improves accuracy (Pass@1) but reduces processing speed (Throughput).
2. **Dataset Sensitivity:** The model's absolute performance (Pass@1) and the magnitude of improvement vary significantly by dataset. AMC23 yields the highest scores (80s-90s), while AIME25 yields the lowest (30s).
3. **Non-Monotonic Pass@1:** While the general trend for Pass@1 is upward, several charts show minor dips or plateaus at specific KV Budgets (e.g., AIME24 at 3500, AIME25 at 4500, AMC23 after 3500), suggesting potential sweet spots or diminishing returns.
4. **Throughput Consistency:** The decline in Throughput is remarkably linear and similar in slope across all charts, indicating the computational cost of increasing KV Budget is dataset-agnostic.
### Interpretation
The data demonstrates a fundamental engineering trade-off in the R1-Qwen model's configuration. **KV Budget** likely controls a resource allocation parameter (e.g., key-value cache size in a transformer model). Increasing this budget allows the model to retain more context or perform more detailed computation, leading to better reasoning accuracy (higher Pass@1) on complex benchmarks like AIME and AMC. However, this comes at a direct and predictable cost to inference speed (lower Throughput).
The variation in Pass@1 scores across datasets suggests the model's capabilities are better aligned with the problem types in AMC23 (likely math competition problems) than in AIME25 or GPQA-D. The plateauing of Pass@1 in some charts (notably GPQA-D) indicates that beyond a certain KV Budget (~3500-4000), additional resources yield negligible accuracy gains, making the throughput penalty unjustifiable for those tasks. This analysis is crucial for optimizing deployment: one must choose a KV Budget that balances the required accuracy for a given task against acceptable latency constraints.