\n
## Line Chart: Inference Compute Scaling
### Overview
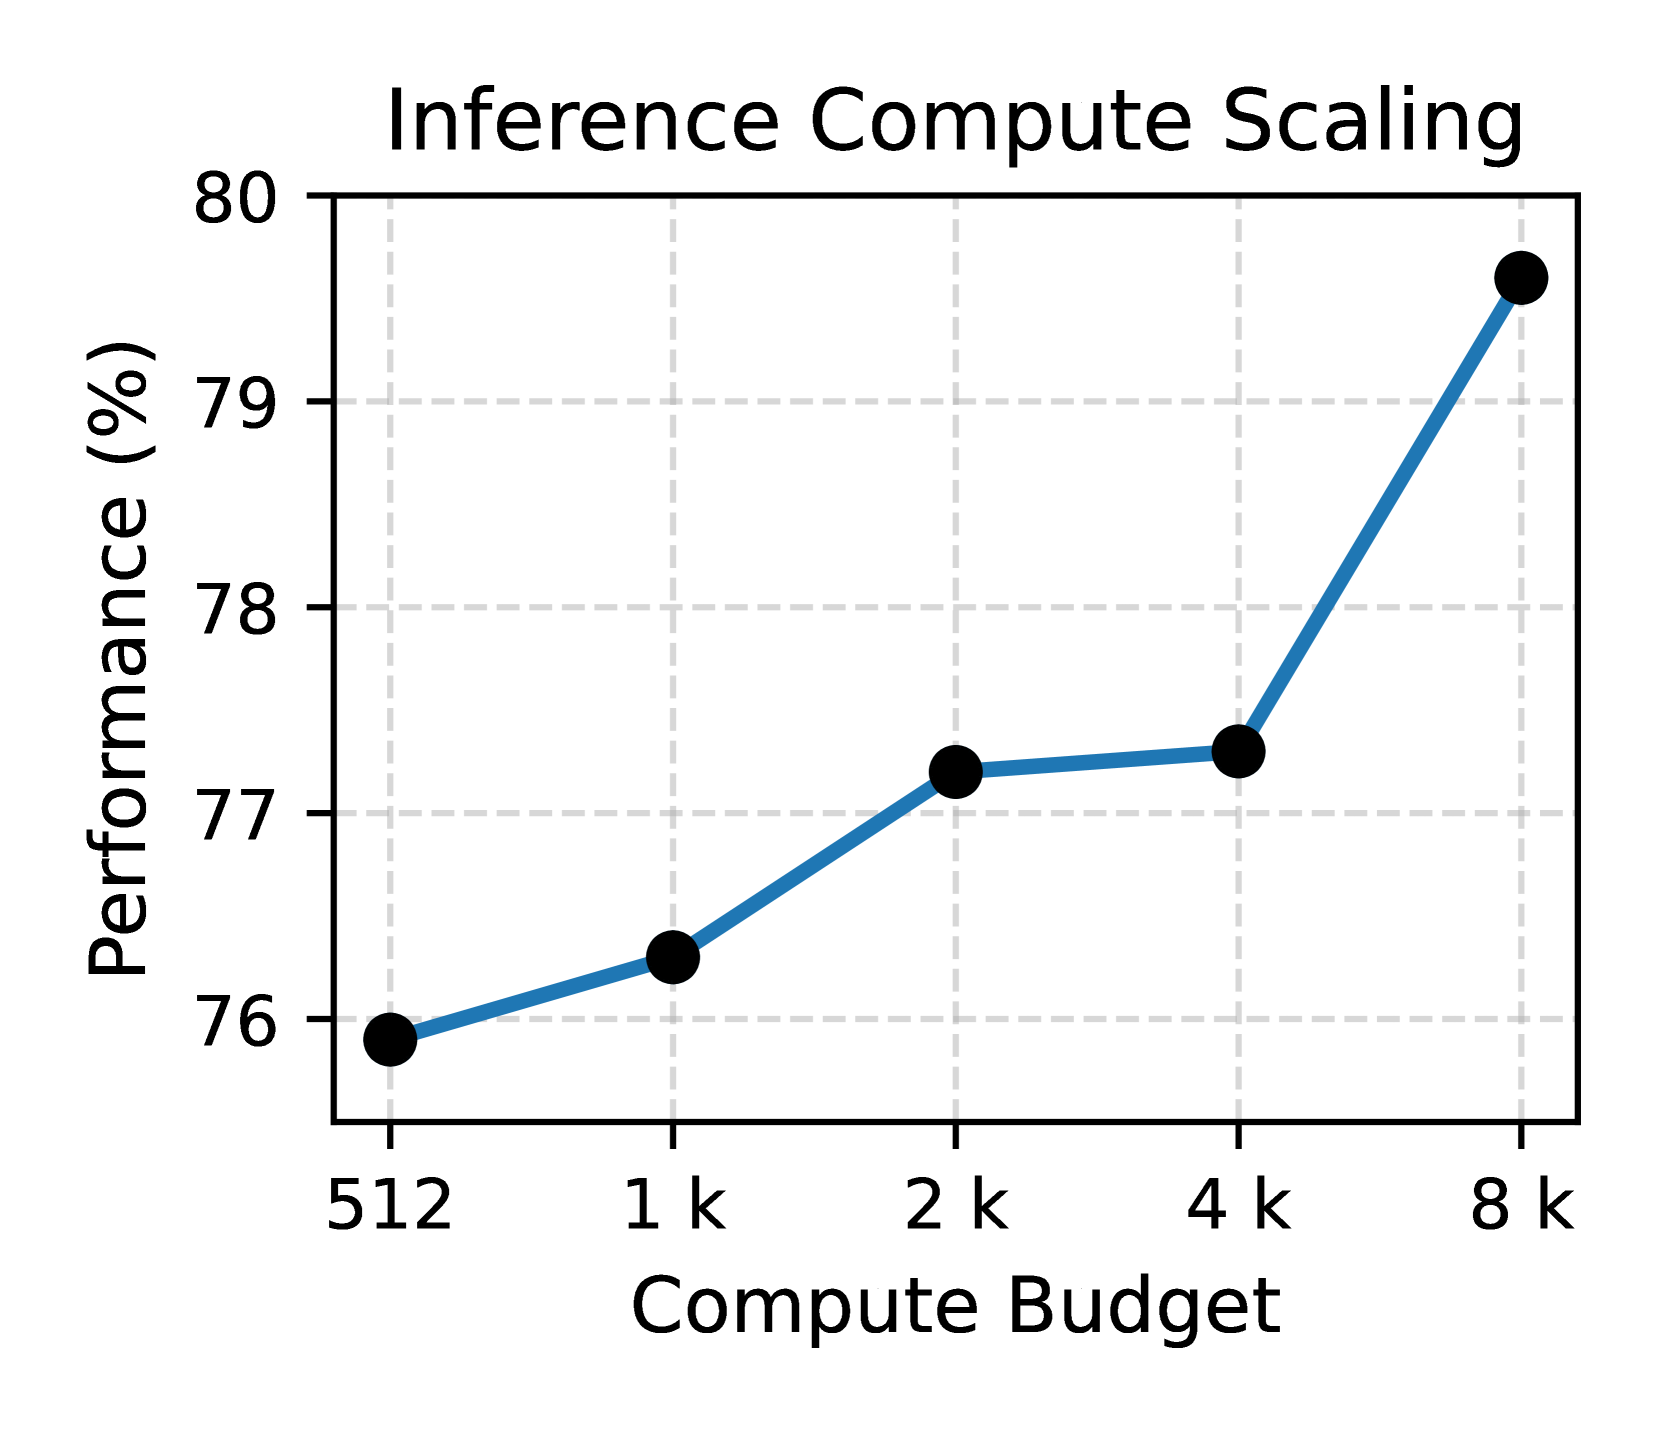
This is a line chart illustrating the relationship between a system's "Compute Budget" and its resulting "Performance" percentage. The chart demonstrates a positive, non-linear correlation where increasing the compute budget leads to improved performance, with the rate of improvement accelerating at higher budget levels.
### Components/Axes
* **Chart Title:** "Inference Compute Scaling" (positioned at the top center).
* **Y-Axis (Vertical):**
* **Label:** "Performance (%)"
* **Scale:** Linear scale ranging from 76 to 80.
* **Major Tick Marks:** 76, 77, 78, 79, 80.
* **X-Axis (Horizontal):**
* **Label:** "Compute Budget"
* **Scale:** Logarithmic scale (base 2), with values doubling at each major tick.
* **Major Tick Mark Labels:** "512", "1 k", "2 k", "4 k", "8 k". (Note: "k" denotes 1000).
* **Data Series:** A single series represented by a solid blue line connecting black circular data points.
* **Legend:** None present; the single data series is self-explanatory from the axis labels.
* **Grid:** Light gray dashed grid lines are present for both major x and y ticks.
### Detailed Analysis
**Trend Verification:** The single data series shows a clear upward trend. The slope is moderate from 512 to 2k, flattens slightly between 2k and 4k, and then increases sharply from 4k to 8k.
**Data Point Extraction (Approximate Values):**
The following values are estimated based on the position of the black data points relative to the y-axis grid lines.
1. **At Compute Budget = 512:** Performance ≈ 75.9% (The point sits just below the 76% grid line).
2. **At Compute Budget = 1 k (1000):** Performance ≈ 76.3% (The point is approximately one-third of the way between the 76% and 77% grid lines).
3. **At Compute Budget = 2 k (2000):** Performance ≈ 77.2% (The point is slightly above the 77% grid line).
4. **At Compute Budget = 4 k (4000):** Performance ≈ 77.3% (The point is marginally higher than the previous point at 2k, indicating a near plateau).
5. **At Compute Budget = 8 k (8000):** Performance ≈ 79.6% (The point is significantly above the 79% grid line, closer to 80% than 79%).
### Key Observations
1. **Non-Linear Scaling:** Performance does not increase linearly with compute budget. The gains are modest at lower budgets, nearly stall between 2k and 4k, and then surge dramatically at 8k.
2. **Significant Final Jump:** The most substantial performance increase (approximately +2.3 percentage points) occurs in the final interval, from a compute budget of 4k to 8k.
3. **Diminishing then Accelerating Returns:** The pattern suggests a region of diminishing returns (2k to 4k) followed by a breakthrough or a different scaling regime at the highest measured budget.
### Interpretation
The chart provides a Peircean insight into the scaling behavior of an inference system. The data suggests that simply doubling the compute budget does not guarantee a proportional performance increase. The near-plateau between 2k and 4k could indicate a bottleneck elsewhere in the system (e.g., memory bandwidth, algorithmic efficiency) that is overcome at the 8k budget level. The sharp rise at 8k implies that the system may have entered a new, more efficient scaling phase, or that a critical threshold of compute was crossed, enabling a qualitative improvement in the model's capability. This pattern is crucial for resource allocation, indicating that investing in compute beyond a certain point (4k in this case) can yield disproportionately high returns, but only if the system architecture can effectively utilize it. The absence of data points beyond 8k leaves open the question of whether this accelerated scaling continues or eventually plateaus again.