\n
## Diagram: Relationship and Ternary Plot
### Overview
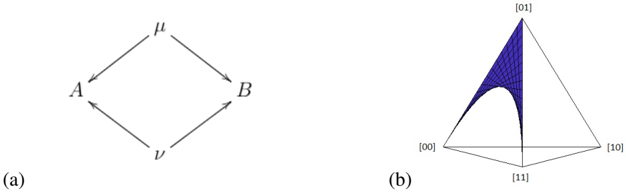
The image presents two diagrams: (a) a directed graph illustrating relationships between elements A, B, and ν, and (b) a ternary plot representing a compositional space.
### Components/Axes
**(a) Directed Graph:**
* Nodes: A, B, ν (nu)
* Edges: A → μ, μ → B, B → ν, ν → A
* Label: μ (placed above the edge connecting A and B)
**(b) Ternary Plot:**
* Axes: Represented by corner labels [00], [10], and [11].
* Plot Surface: A triangular surface filled with a grid of lines.
* Color: The surface is colored in a dark blue.
### Detailed Analysis or Content Details
**(a) Directed Graph:**
The diagram shows a cyclic relationship between A, B, and ν. The arrows indicate the direction of influence or transformation. The element μ appears to be an intermediate state or process connecting A and B. The cycle is A -> μ -> B -> ν -> A.
**(b) Ternary Plot:**
The ternary plot represents a three-component system. The corners of the triangle represent pure compositions of each component. The coordinates [00], [10], and [11] likely represent the proportions of these components. The plot surface shows a distribution or relationship within this compositional space. The grid lines indicate specific compositional ratios. The dark blue color suggests a region of interest or a specific property associated with those compositions. The plot is a 3D representation of a triangular coordinate system.
### Key Observations
**(a) Directed Graph:**
The graph demonstrates a closed-loop system where each element influences the next in a cyclical manner.
**(b) Ternary Plot:**
The ternary plot shows a concentration of the grid lines towards the center of the triangle, suggesting a preference for intermediate compositions. The plot is symmetrical along the line connecting [10] and [11].
### Interpretation
**(a) Directed Graph:**
This diagram could represent a chemical reaction, a biological pathway, or a system of interacting agents. The element μ could be a catalyst or an intermediate product. The cyclic nature suggests a self-sustaining process.
**(b) Ternary Plot:**
The ternary plot is commonly used in materials science, geochemistry, and other fields to visualize the composition of mixtures. The plot suggests that the system favors compositions that are not purely one component but rather a blend of two or more. The specific shape of the distribution on the plot would reveal more about the properties of the system. The plot is a visual representation of a compositional space, where each point within the triangle represents a unique combination of three components. The plot is a 3D representation of a triangular coordinate system.