## Line Chart: KNN vs SVM Prediction Over Time
### Overview
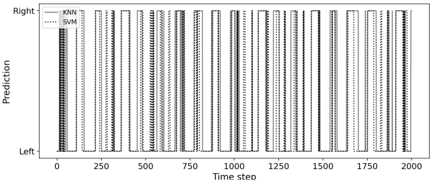
The image is a line chart comparing the predictions of two machine learning models, KNN (K-Nearest Neighbors) and SVM (Support Vector Machine), over a series of time steps. The chart displays the predicted output (either "Left" or "Right") for each model at each time step. The x-axis represents the time step, ranging from 0 to 2000. The y-axis represents the prediction, with "Left" at the bottom and "Right" at the top.
### Components/Axes
* **X-axis:** Time step, ranging from 0 to 2000, with markers at 0, 250, 500, 750, 1000, 1250, 1500, 1750, and 2000.
* **Y-axis:** Prediction, labeled "Prediction", with "Left" at the bottom and "Right" at the top.
* **Legend:** Located in the top-left corner.
* KNN: Solid gray line.
* SVM: Dotted gray line.
### Detailed Analysis
* **KNN (Solid Gray Line):** The KNN model's prediction alternates between "Left" and "Right" in a step-wise fashion. The transitions between "Left" and "Right" appear to be relatively consistent in duration.
* **SVM (Dotted Gray Line):** The SVM model's prediction also alternates between "Left" and "Right" in a step-wise fashion. The transitions between "Left" and "Right" appear to be relatively consistent in duration.
* **Comparison:** The KNN and SVM models appear to have very similar prediction patterns, with the SVM model's transitions slightly lagging behind the KNN model's transitions in some instances.
### Key Observations
* Both models exhibit a clear pattern of alternating predictions between "Left" and "Right."
* The SVM model's predictions closely follow the KNN model's predictions, with minor timing differences.
* The frequency of switching between "Left" and "Right" appears relatively consistent throughout the time series.
### Interpretation
The chart suggests that both the KNN and SVM models are effectively capturing the underlying pattern in the data, which involves alternating between two states ("Left" and "Right"). The slight lag observed in the SVM model's predictions compared to the KNN model could be due to differences in the model's internal mechanisms or training data. The consistent frequency of state transitions suggests a periodic or rhythmic pattern in the data being predicted. The close agreement between the two models indicates that both are learning similar representations of the underlying data structure.