\n
## Line Chart: Prediction over Time Step
### Overview
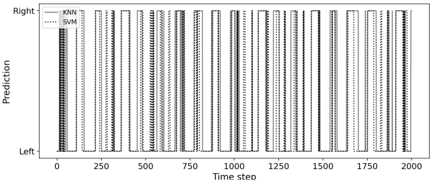
The image presents a line chart illustrating the predictions of three different machine learning models (KNN, SVM, and a model without a label) over 2000 time steps. The y-axis represents the prediction (categorized as "Left" or "Right"), and the x-axis represents the "Time step". The chart displays the models' predictions as oscillating lines between these two categories.
### Components/Axes
* **X-axis:** "Time step" ranging from 0 to 2000, with major ticks at intervals of 250.
* **Y-axis:** "Prediction" with two categories: "Left" and "Right".
* **Legend:** Located in the top-left corner, identifying the three lines:
* KNN (solid line)
* SVM (dashed line)
* Unnamed model (dotted line)
### Detailed Analysis
The chart shows a repeating pattern of predictions over time. All three models exhibit a cyclical behavior, alternating between predicting "Left" and "Right".
* **KNN (solid line):** The KNN model consistently predicts "Right" for approximately the first 100 time steps, then switches to "Left" for the next 100 time steps, and repeats this pattern throughout the entire 2000 time steps. The transitions between "Left" and "Right" appear relatively sharp.
* **SVM (dashed line):** The SVM model also exhibits the same cyclical pattern as KNN, alternating between "Right" and "Left" predictions every 100 time steps. However, the transitions are less abrupt than those of the KNN model, with some intermediate values.
* **Unnamed model (dotted line):** This model also follows the same cyclical pattern, alternating between "Right" and "Left" predictions every 100 time steps. The transitions are similar to the SVM model, showing some intermediate values.
Visually, the three models appear to be highly correlated, with all three lines following a similar trajectory. The models consistently predict "Right" between approximately time steps 0-100, 200-300, 400-500, 600-700, 800-900, 1000-1100, 1200-1300, 1400-1500, 1600-1700, 1800-1900. And consistently predict "Left" between approximately time steps 100-200, 300-400, 500-600, 700-800, 900-1000, 1100-1200, 1300-1400, 1500-1600, 1700-1800, 1900-2000.
### Key Observations
* All three models demonstrate a strong cyclical pattern in their predictions.
* The models are highly correlated, suggesting they are responding to the same underlying patterns in the data.
* The KNN model exhibits the most abrupt transitions between "Left" and "Right" predictions.
* The SVM and unnamed models show smoother transitions.
### Interpretation
The chart suggests that the underlying data has a periodic or cyclical nature, causing the models to consistently alternate between predicting "Left" and "Right". The high correlation between the models indicates that they are all capturing the same fundamental pattern. The differences in transition smoothness may reflect the models' sensitivity to noise or their decision boundaries. The consistent pattern suggests a deterministic or highly predictable system. The fact that all models perform similarly suggests that the choice of model may not be critical in this particular scenario, as long as it can capture the cyclical pattern. The absence of a label for the third model hinders a more detailed comparison and interpretation.