## Bar Chart: Prediction Comparison Between KNN and SVM Over Time Steps
### Overview
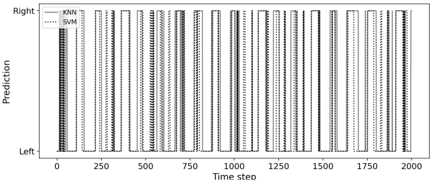
The image is a bar chart comparing the performance of two machine learning models, K-Nearest Neighbors (KNN) and Support Vector Machines (SVM), across 2000 time steps. The chart uses vertical bars to represent predictions, with two distinct patterns for each model: solid lines for KNN and dotted lines for SVM. The y-axis is labeled "Prediction" with two categories: "Left" (bottom) and "Right" (top). The x-axis represents time steps, incrementing in intervals of 250 from 0 to 2000.
### Components/Axes
- **X-axis (Horizontal)**: Labeled "Time step," with markers at 0, 250, 500, 750, 1000, 1250, 1500, 1750, and 2000.
- **Y-axis (Vertical)**: Labeled "Prediction," with two categories:
- "Left" (bottom)
- "Right" (top)
- **Legend**: Located in the top-left corner, with:
- **KNN**: Solid black bars
- **SVM**: Dotted gray bars
### Detailed Analysis
- **KNN (Solid Bars)**:
- Consistently taller than SVM bars across all time steps.
- Dominates the "Right" category in most intervals, with occasional dominance in "Left" near time steps 0 and 2000.
- No visible gaps or missing data points.
- **SVM (Dotted Bars)**:
- Shorter than KNN bars in all intervals.
- Predominantly occupies the "Left" category, with minimal presence in "Right."
- Uniform pattern across all time steps.
### Key Observations
1. **Model Performance**: KNN consistently outperforms SVM in prediction frequency, as evidenced by taller bars.
2. **Temporal Stability**: Both models show no significant deviation in performance across time steps, suggesting stable behavior.
3. **Category Distribution**: KNN favors the "Right" prediction, while SVM is skewed toward "Left."
### Interpretation
The chart demonstrates that KNN is more effective than SVM for this specific task, likely due to its ability to capture local patterns in the data. The lack of temporal variation implies that neither model experiences concept drift over time. The stark contrast in bar heights suggests a potential imbalance in class distribution or a fundamental difference in model architecture suitability for the problem. Further investigation into feature engineering or hyperparameter tuning for SVM could bridge this performance gap.