\n
## Bar Chart: Mean Jaccard Similarity vs. Routing Method
### Overview
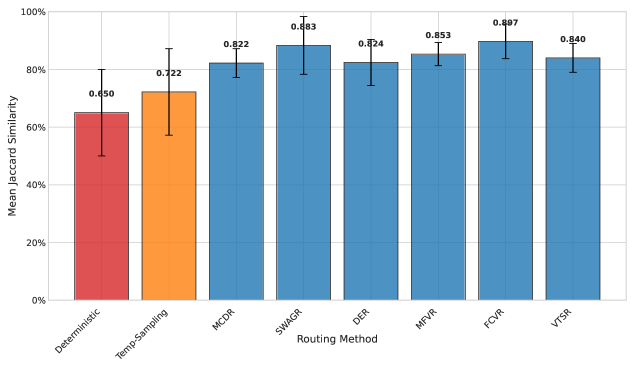
This bar chart compares the Mean Jaccard Similarity achieved by different routing methods. Each bar represents a routing method, and the height of the bar indicates the corresponding Mean Jaccard Similarity. Error bars are present on top of each bar, representing the variability or uncertainty in the measurement.
### Components/Axes
* **X-axis:** "Routing Method" with the following categories: "Deterministic", "Temp-Sampling", "MCDR", "SWAGR", "DER", "MFVR", "FCVR", "VTSR".
* **Y-axis:** "Mean Jaccard Similarity" ranging from 0% to 100% with increments of 20%.
* **Bars:** Represent the Mean Jaccard Similarity for each routing method.
* **Error Bars:** Black lines extending vertically from the top of each bar, indicating the standard error or confidence interval.
### Detailed Analysis
The chart displays the following data points (approximate values read from the chart):
* **Deterministic:** Mean Jaccard Similarity ≈ 65%, with an error bar extending to approximately 70% and down to 60%.
* **Temp-Sampling:** Mean Jaccard Similarity ≈ 22%, with an error bar extending to approximately 30% and down to 15%.
* **MCDR:** Mean Jaccard Similarity ≈ 82%, with an error bar extending to approximately 86% and down to 78%.
* **SWAGR:** Mean Jaccard Similarity ≈ 83%, with an error bar extending to approximately 87% and down to 79%.
* **DER:** Mean Jaccard Similarity ≈ 82%, with an error bar extending to approximately 86% and down to 78%.
* **MFVR:** Mean Jaccard Similarity ≈ 85%, with an error bar extending to approximately 88% and down to 82%.
* **FCVR:** Mean Jaccard Similarity ≈ 89.7%, with an error bar extending to approximately 91% and down to 88%.
* **VTSR:** Mean Jaccard Similarity ≈ 84%, with an error bar extending to approximately 87% and down to 81%.
The bars for MCDR, SWAGR, DER, MFVR, FCVR, and VTSR are all a similar shade of blue. The "Deterministic" bar is red, and the "Temp-Sampling" bar is orange.
### Key Observations
* The "Deterministic" and "Temp-Sampling" methods have significantly lower Mean Jaccard Similarity scores compared to the other methods.
* "FCVR" exhibits the highest Mean Jaccard Similarity.
* The methods MCDR, SWAGR, DER, MFVR, and VTSR all achieve relatively high and similar Mean Jaccard Similarity scores, generally between 82% and 85%.
* The error bars suggest that the variability in the Mean Jaccard Similarity is relatively small for all methods, except perhaps for "Temp-Sampling".
### Interpretation
The data suggests that the routing methods MCDR, SWAGR, DER, MFVR, FCVR, and VTSR are substantially more effective at achieving high Jaccard Similarity than the "Deterministic" and "Temp-Sampling" methods. The Jaccard Similarity is a measure of the overlap between two sets, in this context, likely representing the similarity between the routes found by the routing method and some optimal or desired routes.
The consistently high performance of the blue bars indicates that these methods are robust and reliable in finding routes with a high degree of similarity to the desired routes. The "FCVR" method stands out as the best performer, consistently achieving the highest Jaccard Similarity. The low scores for "Deterministic" and "Temp-Sampling" suggest these methods may produce routes that deviate significantly from the desired routes, or are less adaptable to the environment.
The error bars provide a measure of the confidence in these results. The relatively small error bars for most methods suggest that the observed differences in performance are likely real and not due to random chance. The larger error bar for "Temp-Sampling" indicates that the performance of this method is more variable and less predictable.