## Line Graph: I/T Specialization vs. Layers
### Overview
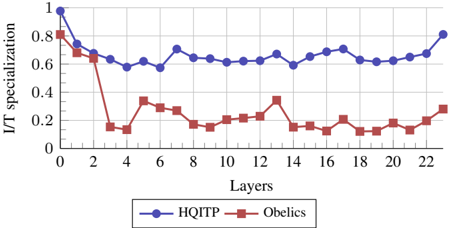
The image is a line graph comparing two data series, "HQITP" (blue circles) and "Obelics" (red squares), across 23 layers (0–22). The y-axis represents "I/T specialization" (0–1), while the x-axis represents "Layers." The graph shows distinct trends for both series, with HQITP maintaining higher values overall and Obelics declining sharply after layer 2.
### Components/Axes
- **X-axis (Layers)**: Labeled "Layers," with increments of 2 from 0 to 22.
- **Y-axis (I/T Specialization)**: Labeled "I/T specialization," with values from 0 to 1 in increments of 0.2.
- **Legend**: Located at the bottom, with blue circles for "HQITP" and red squares for "Obelics."
- **Title**: "I/T Specialization vs. Layers" (implied by axis labels and context).
### Detailed Analysis
- **HQITP (Blue Circles)**:
- Starts at **1.0** at layer 0.
- Drops sharply to **~0.6** by layer 2.
- Fluctuates between **~0.6 and 0.8** from layers 4–22.
- Ends at **~0.8** at layer 22.
- **Obelics (Red Squares)**:
- Starts at **0.8** at layer 0.
- Drops sharply to **~0.2** by layer 2.
- Fluctuates between **~0.1 and 0.3** from layers 4–22.
- Ends at **~0.3** at layer 22.
### Key Observations
1. **HQITP** maintains consistently higher I/T specialization values than Obelics across all layers.
2. Both series experience a sharp decline in the first two layers, but HQITP recovers more effectively.
3. Obelics shows greater volatility and lower values after layer 2, with no significant recovery.
4. HQITP’s values stabilize near 0.6–0.8 after layer 2, while Obelics remains below 0.3.
### Interpretation
The graph suggests that HQITP demonstrates greater resilience and stability in I/T specialization compared to Obelics. The sharp initial decline for both series may indicate a common factor affecting early layers, but HQITP’s recovery implies superior adaptability or efficiency in later layers. Obelics’ persistent low values could signal limitations in scalability or performance under increasing layer complexity. The data highlights a clear divergence in performance between the two series, with HQITP emerging as the more robust option.