## Line Graph: LM Loss vs. PFlOP/s-days Projections
### Overview
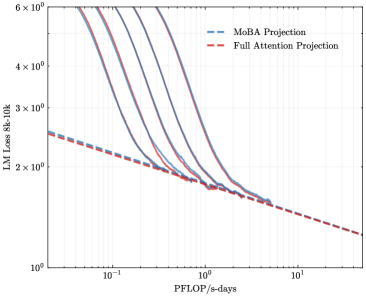
The image depicts a logarithmic-scale line graph comparing two computational efficiency projections: "MoBA Projection" (blue dashed line) and "Full Attention Projection" (red dashed line). Both axes use logarithmic scaling, with the x-axis representing computational resources (PFlOP/s-days) and the y-axis representing language model loss (LM Loss 8k-10k). The graph shows performance trends across orders of magnitude in computational power.
### Components/Axes
- **X-axis (PFlOP/s-days)**: Logarithmic scale from 10⁻¹ to 10¹ (0.1 to 10).
- **Y-axis (LM Loss 8k-10k)**: Logarithmic scale from 10⁰ to 6×10⁰ (1 to 6).
- **Legend**: Located in the top-right corner, with:
- Blue dashed line: "MoBA Projection"
- Red dashed line: "Full Attention Projection"
- **Grid**: Light gray grid lines for reference.
### Detailed Analysis
1. **MoBA Projection (Blue Dashed Line)**:
- Starts at ~5×10⁰ LM Loss at 10⁻¹ PFlOP/s-days.
- Gradually declines to ~1.5×10⁰ at 10¹ PFlOP/s-days.
- Maintains a consistent downward slope with minimal curvature.
2. **Full Attention Projection (Red Dashed Line)**:
- Begins at ~5×10⁰ LM Loss at 10⁻¹ PFlOP/s-days.
- Drops sharply to ~2×10⁰ at 10⁰ PFlOP/s-days.
- Continues declining to ~1.2×10⁰ at 10¹ PFlOP/s-days.
- Exhibits a steeper slope than the MoBA Projection, especially between 10⁻¹ and 10⁰ PFlOP/s-days.
3. **Key Intersection**:
- Both lines converge near 10⁰ PFlOP/s-days (~2×10⁰ LM Loss), after which their divergence narrows.
### Key Observations
- **Performance Gap**: The Full Attention Projection consistently achieves lower LM Loss than the MoBA Projection across all PFlOP/s-days values.
- **Efficiency Scaling**: Full Attention Projection demonstrates a 3× improvement in LM Loss reduction between 10⁻¹ and 10⁰ PFlOP/s-days, compared to MoBA's ~3× improvement over the same range.
- **Diminishing Returns**: Both projections show reduced slope steepness beyond 10⁰ PFlOP/s-days, indicating diminishing returns on computational investment.
### Interpretation
The data suggests that the Full Attention Projection model achieves superior computational efficiency, reducing LM Loss more effectively than the MoBA Projection as resources increase. The steeper decline of the red line implies architectural or algorithmic advantages in the Full Attention approach, potentially through optimized attention mechanisms. The convergence near 10⁰ PFlOP/s-days hints at a performance ceiling for both models under extreme computational constraints. This analysis aligns with trends in transformer-based model optimization, where attention mechanisms often provide significant efficiency gains over baseline architectures.