## Line Chart: Proportion of Bitwise Reproducible Packages Over Time
### Overview
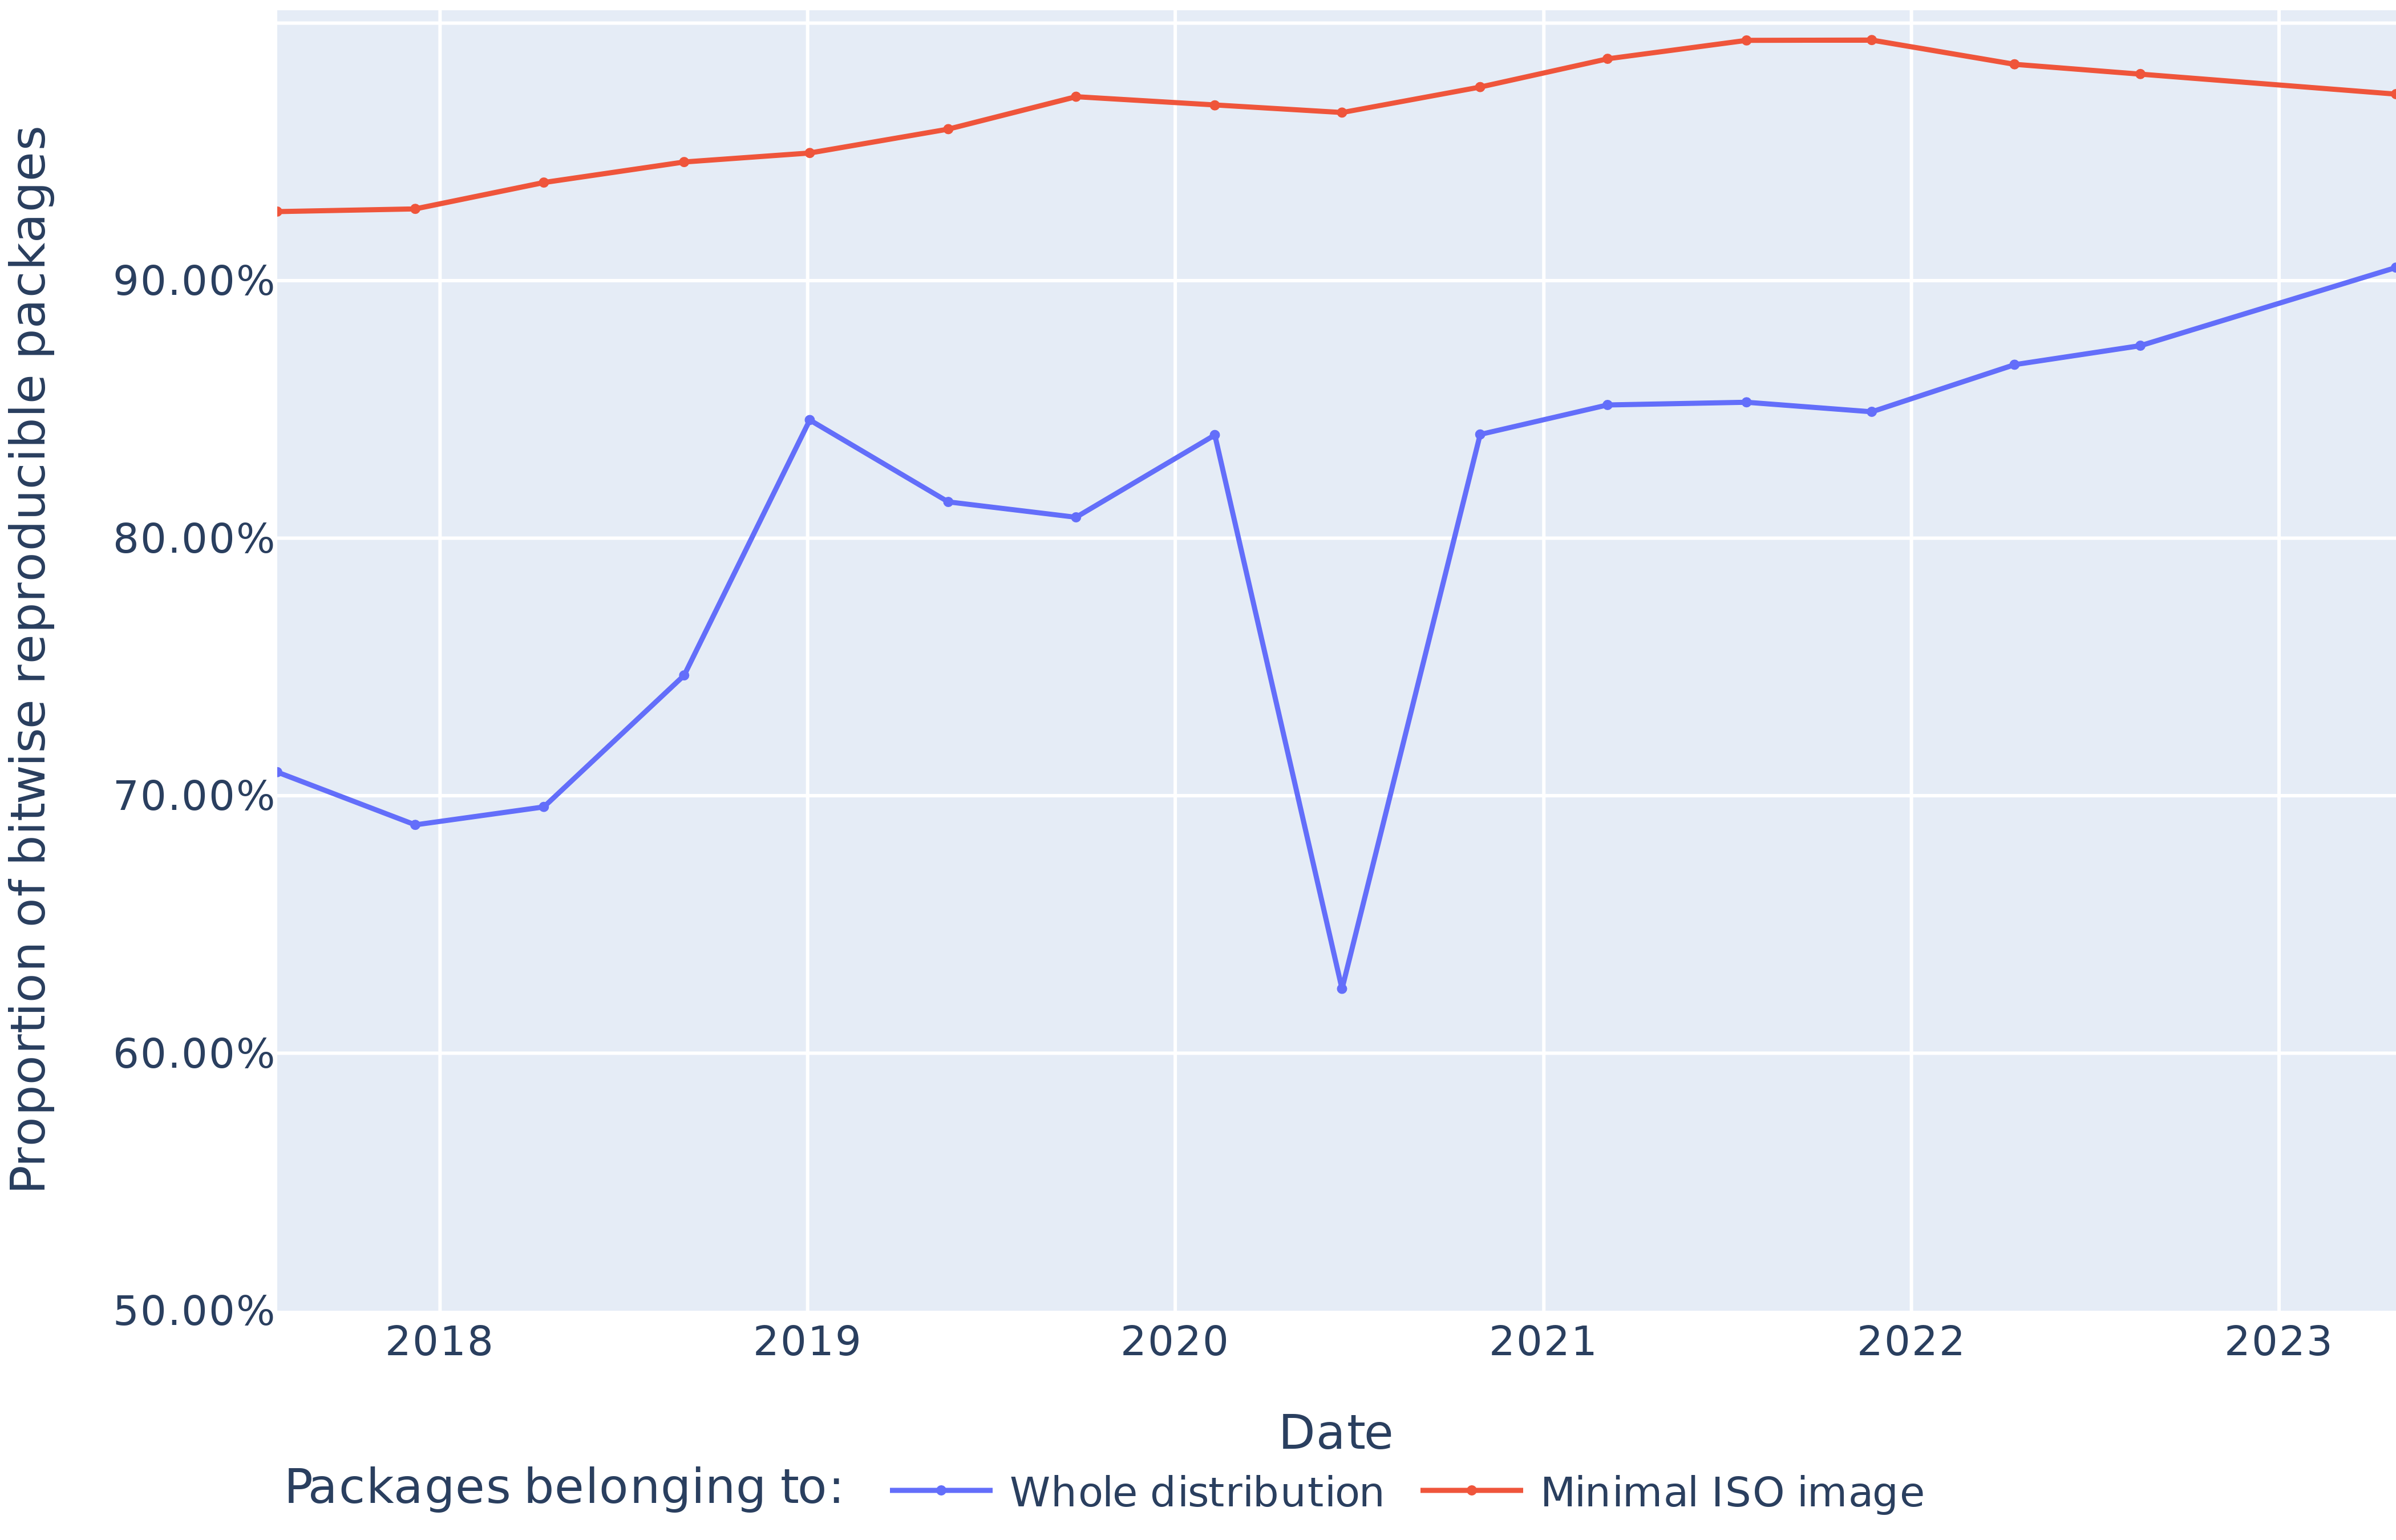
This is a line chart tracking the percentage of software packages that are "bitwise reproducible" over a period from approximately early 2017 to early 2023. It compares two distinct categories of packages within a software distribution. The chart shows a general upward trend for both categories, with one category maintaining a consistently high proportion and the other showing significant volatility before a strong recovery.
### Components/Axes
* **Chart Type:** Line chart with two data series.
* **Y-Axis (Vertical):**
* **Label:** "Proportion of bitwise reproducible packages"
* **Scale:** Percentage, ranging from 50.00% to 95.00% (visible gridlines at 50%, 60%, 70%, 80%, 90%).
* **X-Axis (Horizontal):**
* **Label:** "Date"
* **Scale:** Time, with major year markers for 2018, 2019, 2020, 2021, 2022, and 2023. Data points appear to be plotted at intervals more frequent than yearly (likely quarterly or monthly).
* **Legend:** Located at the bottom center of the chart.
* **Title:** "Packages belonging to:"
* **Series 1:** A blue line with circular markers labeled "Whole distribution".
* **Series 2:** A red/orange line with circular markers labeled "Minimal ISO image".
### Detailed Analysis
**1. "Minimal ISO image" (Red/Orange Line):**
* **Trend:** This line demonstrates a stable, high, and slightly increasing trend over the entire period. It starts just above 92% in early 2017, climbs gradually to a peak of approximately 95% around mid-2022, and then shows a very slight decline into 2023, ending near 94%.
* **Key Data Points (Approximate):**
* Start (2017): ~92.5%
* Peak (Mid-2022): ~95.0%
* End (Early 2023): ~94.0%
* **Spatial Grounding:** This is the top line on the chart, consistently positioned above the blue line.
**2. "Whole distribution" (Blue Line):**
* **Trend:** This line is highly volatile. It begins around 71%, dips slightly in 2018, then rises sharply to a local peak of ~84% in early 2019. It fluctuates between 80-84% through 2019 and early 2020 before experiencing a dramatic, sharp drop to its lowest point of ~62% in mid-2020. Following this trough, it recovers rapidly, climbing back to ~84% by early 2021. From 2021 onward, it shows a steady, consistent upward trend, surpassing its previous peak and ending at approximately 90% in early 2023.
* **Key Data Points (Approximate):**
* Start (2017): ~71.0%
* First Peak (Early 2019): ~84.0%
* Major Trough (Mid-2020): ~62.0%
* Recovery Peak (Early 2021): ~84.0%
* End (Early 2023): ~90.0%
* **Spatial Grounding:** This is the lower, more jagged line. Its most notable feature is the deep "V" shape centered on mid-2020.
### Key Observations
1. **Persistent Gap:** There is a consistent and significant gap between the two categories. The "Minimal ISO image" packages are always more reproducible than the "Whole distribution" packages, though this gap narrows considerably by the end of the period (from ~21 percentage points in 2017 to ~4 percentage points in 2023).
2. **The 2020 Anomaly:** The "Whole distribution" series suffers a severe, isolated drop in reproducibility in mid-2020. This is the most striking feature of the chart and suggests a specific event or change that temporarily broke reproducibility for a large subset of packages.
3. **Strong Post-2020 Recovery:** After the 2020 trough, the "Whole distribution" not only recovers to its previous levels but embarks on its most sustained period of growth, indicating a successful effort to improve reproducibility across the broader package set.
4. **Convergence Trend:** The trajectories of the two lines from 2021 to 2023 suggest a convergence, where the reproducibility of the entire distribution is catching up to the high standard set by the minimal core image.
### Interpretation
This chart visualizes the challenge and progress of achieving software build reproducibility. The "Minimal ISO image" represents a curated, core set of packages where reproducibility is a high priority and is easier to achieve due to fewer dependencies and a controlled environment. Its consistently high rate (>92%) shows this is a solvable problem.
The "Whole distribution" line represents the much harder task of making *all* packages in a large, complex ecosystem reproducible. Its volatility, especially the 2020 crash, highlights how fragile the process can be—susceptible to toolchain updates, dependency changes, or infrastructure shifts. The dramatic recovery and subsequent steady climb, however, are highly positive indicators. They suggest that the distribution's maintainers identified the causes of the 2020 failure, implemented robust fixes, and established sustainable practices that are now yielding continuous improvement. The narrowing gap implies that the principles and tooling developed for the minimal image are being successfully scaled to the entire distribution.