## Line Charts: Model Performance vs. Layer Index
### Overview
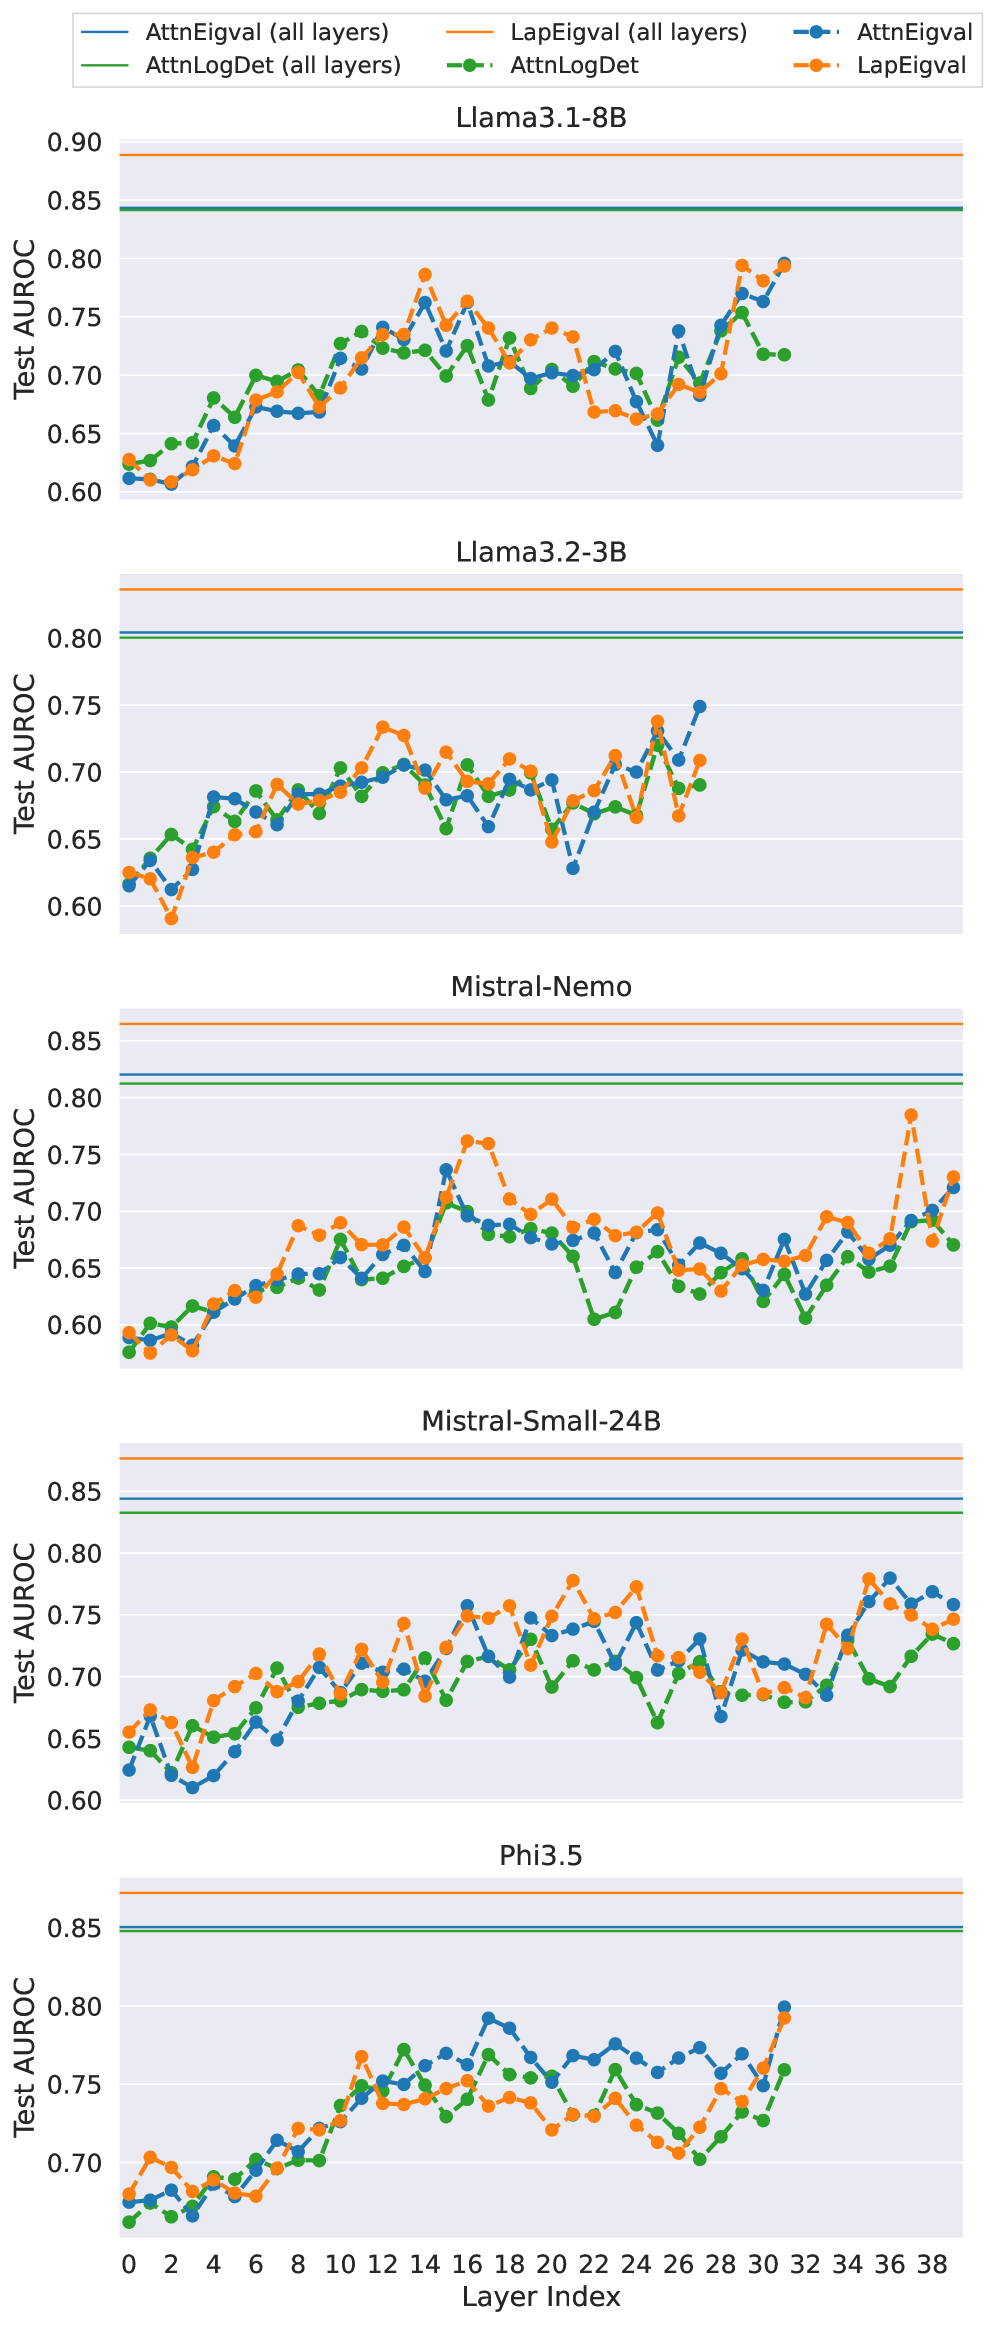
The image contains five line charts, each displaying the performance (Test AUROC) of different models (Llama3.1-8B, Llama3.2-3B, Mistral-Nemo, Mistral-Small-24B, and Phi3.5) across various layer indices. Each chart plots four data series: "AttnEigval (all layers)", "AttnLogDet (all layers)", "LapEigval (all layers)", "AttnLogDet", and "LapEigval". The x-axis represents the layer index, and the y-axis represents the Test AUROC score.
### Components/Axes
* **Y-axis Title:** "Test AUROC"
* Scale: 0.60 to 0.90 (varying slightly between charts)
* Markers: 0.60, 0.65, 0.70, 0.75, 0.80, 0.85
* **X-axis Title:** "Layer Index"
* Scale: 0 to 38
* Markers: 0, 2, 4, 6, 8, 10, 12, 14, 16, 18, 20, 22, 24, 26, 28, 30, 32, 34, 36, 38
* **Chart Titles (Model Names):**
* Llama3.1-8B (Top Chart)
* Llama3.2-3B
* Mistral-Nemo
* Mistral-Small-24B
* Phi3.5 (Bottom Chart)
* **Legend (Top-Left):**
* AttnEigval (all layers): Solid Teal Line
* AttnLogDet (all layers): Solid Green Line
* LapEigval (all layers): Solid Orange Line
* AttnEigval: Dashed Blue Line with Circle Markers
* AttnLogDet: Dashed Green Line with Circle Markers
* LapEigval: Dashed Orange Line with Circle Markers
### Detailed Analysis
**1. Llama3.1-8B**
* **AttnEigval (all layers) (Teal):** Constant at approximately 0.85.
* **AttnLogDet (all layers) (Green):** Constant at approximately 0.84.
* **LapEigval (all layers) (Orange):** Constant at approximately 0.89.
* **AttnEigval (Blue):** Starts around 0.62, increases to approximately 0.78 around layer 18, then fluctuates between 0.65 and 0.75.
* **AttnLogDet (Green):** Starts around 0.62, increases to approximately 0.75 around layer 12, then fluctuates between 0.65 and 0.75.
* **LapEigval (Orange):** Starts around 0.62, increases to approximately 0.78 around layer 10, then fluctuates between 0.65 and 0.78.
**2. Llama3.2-3B**
* **AttnEigval (all layers) (Teal):** Constant at approximately 0.80.
* **AttnLogDet (all layers) (Green):** Constant at approximately 0.79.
* **LapEigval (all layers) (Orange):** Constant at approximately 0.82.
* **AttnEigval (Blue):** Starts around 0.60, increases to approximately 0.75 around layer 24, then fluctuates between 0.62 and 0.75.
* **AttnLogDet (Green):** Starts around 0.60, increases to approximately 0.72 around layer 12, then fluctuates between 0.62 and 0.72.
* **LapEigval (Orange):** Starts around 0.58, increases to approximately 0.75 around layer 24, then fluctuates between 0.62 and 0.75.
**3. Mistral-Nemo**
* **AttnEigval (all layers) (Teal):** Constant at approximately 0.82.
* **AttnLogDet (all layers) (Green):** Constant at approximately 0.81.
* **LapEigval (all layers) (Orange):** Constant at approximately 0.86.
* **AttnEigval (Blue):** Starts around 0.60, increases to approximately 0.75 around layer 18, then fluctuates between 0.62 and 0.75.
* **AttnLogDet (Green):** Starts around 0.60, increases to approximately 0.70 around layer 12, then fluctuates between 0.60 and 0.70.
* **LapEigval (Orange):** Starts around 0.60, increases to approximately 0.78 around layer 16, then fluctuates between 0.65 and 0.78, with a spike around layer 30.
**4. Mistral-Small-24B**
* **AttnEigval (all layers) (Teal):** Constant at approximately 0.85.
* **AttnLogDet (all layers) (Green):** Constant at approximately 0.84.
* **LapEigval (all layers) (Orange):** Constant at approximately 0.87.
* **AttnEigval (Blue):** Starts around 0.62, increases to approximately 0.75 around layer 18, then fluctuates between 0.65 and 0.75.
* **AttnLogDet (Green):** Starts around 0.65, increases to approximately 0.72 around layer 12, then fluctuates between 0.65 and 0.72.
* **LapEigval (Orange):** Starts around 0.62, increases to approximately 0.78 around layer 16, then fluctuates between 0.65 and 0.78.
**5. Phi3.5**
* **AttnEigval (all layers) (Teal):** Constant at approximately 0.85.
* **AttnLogDet (all layers) (Green):** Constant at approximately 0.84.
* **LapEigval (all layers) (Orange):** Constant at approximately 0.87.
* **AttnEigval (Blue):** Starts around 0.68, increases to approximately 0.78 around layer 22, then fluctuates between 0.70 and 0.80.
* **AttnLogDet (Green):** Starts around 0.67, increases to approximately 0.75 around layer 12, then fluctuates between 0.70 and 0.75.
* **LapEigval (Orange):** Starts around 0.68, increases to approximately 0.78 around layer 10, then fluctuates between 0.70 and 0.78.
### Key Observations
* The "all layers" variants (AttnEigval, AttnLogDet, LapEigval) consistently show a flat, high performance across all layer indices for each model.
* The other variants (AttnEigval, AttnLogDet, LapEigval) show a general increasing trend in performance as the layer index increases, followed by fluctuations.
* The performance range varies slightly between models, with Llama3.1-8B and Mistral-Small-24B generally showing higher AUROC scores.
* The dashed lines (AttnEigval, AttnLogDet, LapEigval) show more variance than the solid lines (AttnEigval (all layers), AttnLogDet (all layers), LapEigval (all layers)).
### Interpretation
The charts compare the performance of different models using various attention mechanisms across different layers. The "all layers" variants likely represent a baseline or a model trained using information from all layers, resulting in stable and high performance. The other variants, which show performance fluctuations with layer index, might represent models that focus on specific layers or have a more dynamic attention mechanism.
The initial increase in performance for the non-"all layers" variants suggests that early layers contribute significantly to the model's learning. The subsequent fluctuations could indicate that different layers specialize in different aspects of the task, or that the attention mechanism is adapting to the input data.
The differences in performance between models could be attributed to variations in architecture, training data, or optimization strategies. The higher AUROC scores for Llama3.1-8B and Mistral-Small-24B suggest that these models are better suited for the task being evaluated.