TECHNICAL ASSET FINGERPRINT
a76150cfb3c8950a30f0b2dc
Click to view fullscreen
Press ESC or click to close
FOUND IN PAPERS
EXPERT: healer-alpha-free VERSION 1
RUNTIME: free/openrouter/healer-alpha
INTEL_VERIFIED
## Multi-Panel Line Chart: Per-Layer Test AUROC for Various Language Models
### Overview
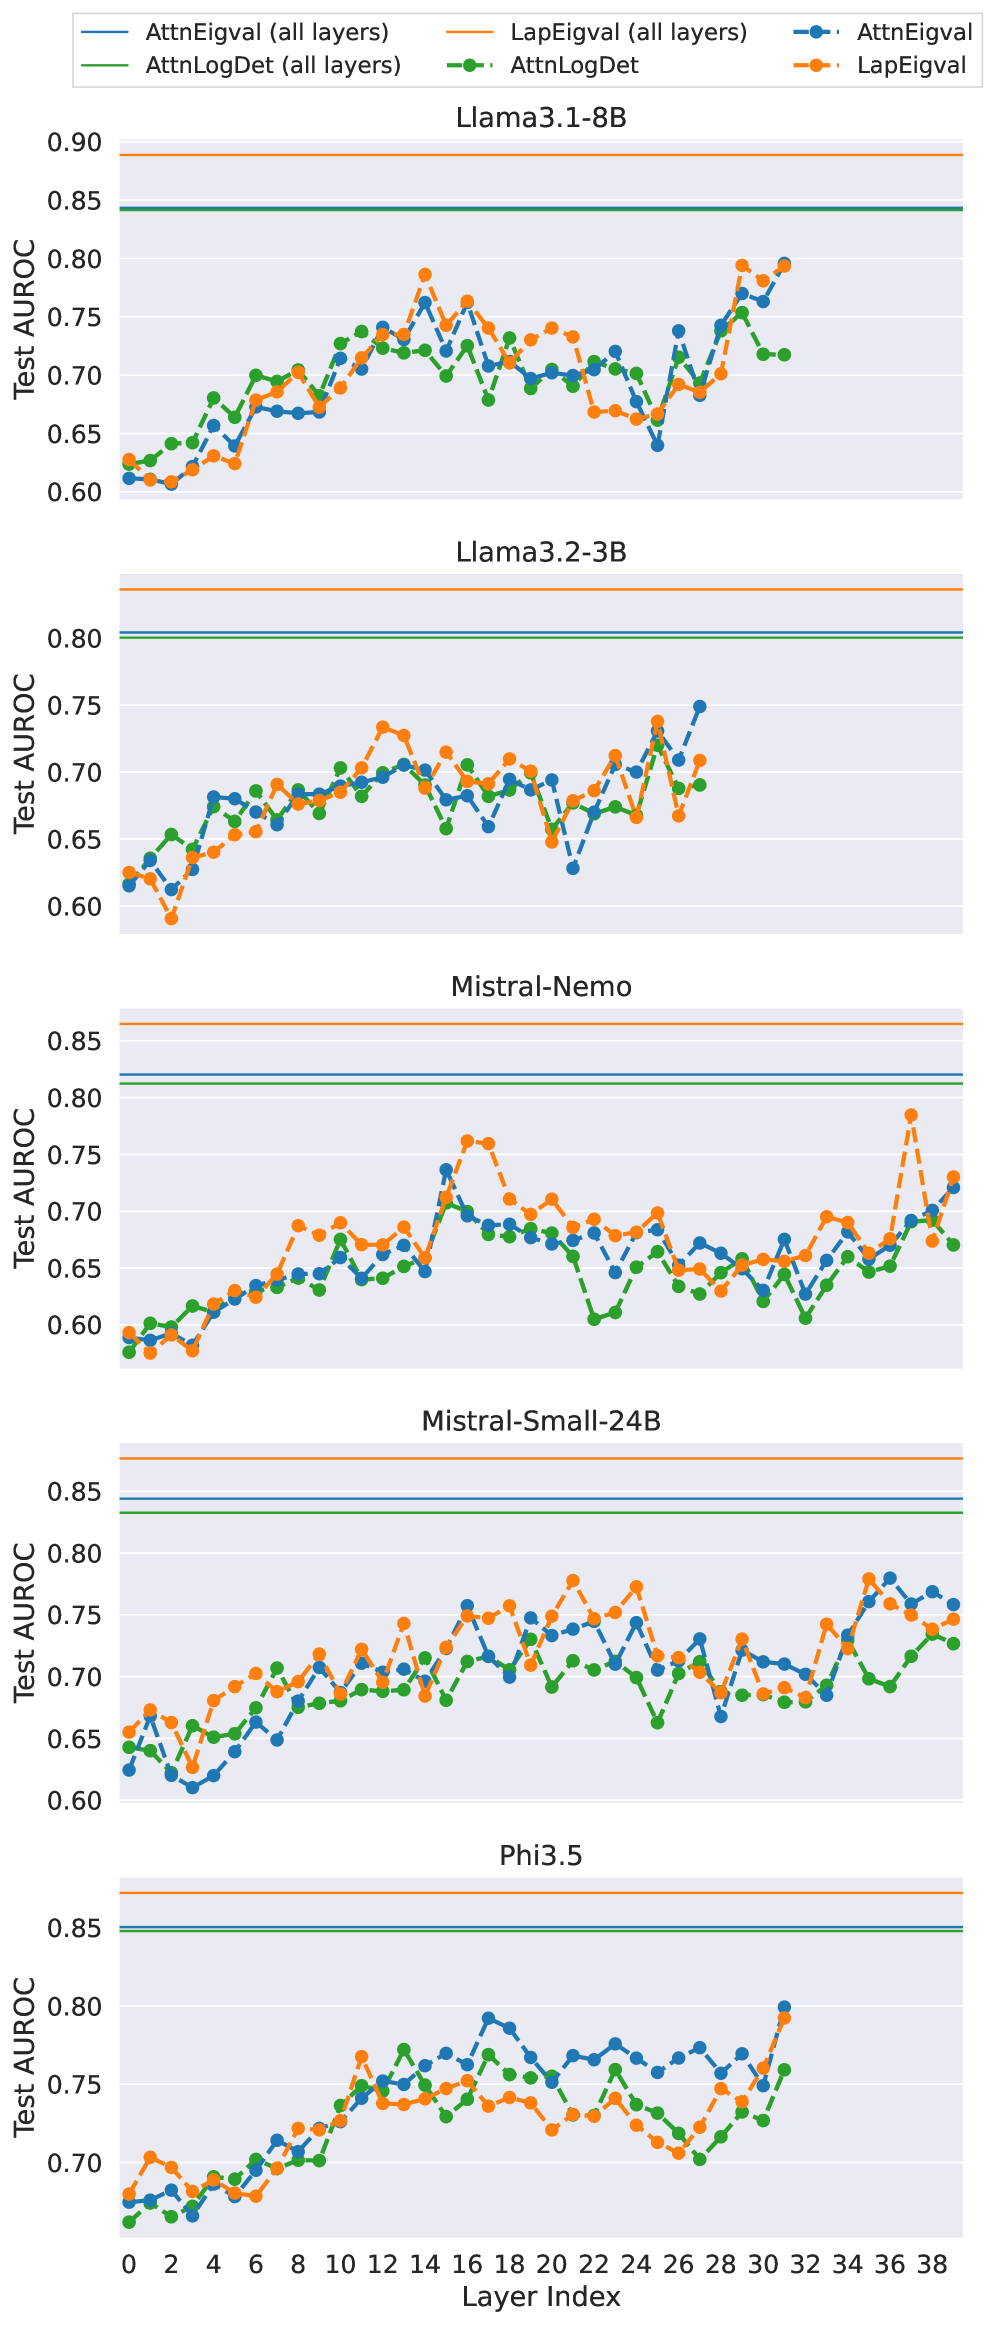
The image displays a series of five vertically stacked line charts. Each chart plots the Test AUROC (Area Under the Receiver Operating Characteristic curve) performance of three different metrics across the layers of a specific large language model (LLM). The charts compare the performance of metrics calculated per individual layer against a baseline performance calculated using all layers combined.
### Components/Axes
* **Legend (Top Center):** A horizontal legend defines six data series:
* `AttnEigval (all layers)`: Solid blue line.
* `AttnLogDet (all layers)`: Solid green line.
* `LapEigval (all layers)`: Solid orange line.
* `AttnEigval`: Dashed blue line with circular markers.
* `AttnLogDet`: Dashed green line with circular markers.
* `LapEigval`: Dashed orange line with circular markers.
* **X-Axis (Bottom):** Labeled "Layer Index". The axis is shared across all subplots and ranges from 0 to 38, with major tick marks every 2 units.
* **Y-Axis (Left):** Labeled "Test AUROC". The scale is consistent across all subplots, ranging from approximately 0.60 to 0.90, with major grid lines at 0.05 intervals.
* **Subplot Titles (Centered above each chart):** The five models analyzed are:
1. Llama3.1-8B
2. Llama3.2-3B
3. Mistral-Nemo
4. Mistral-Small-24B
5. Phi3.5
* **Horizontal Reference Lines:** Each subplot contains three solid horizontal lines near the top, corresponding to the "all layers" metrics from the legend. Their vertical position indicates the constant Test AUROC value for that metric when applied to the entire model.
### Detailed Analysis
**1. Llama3.1-8B**
* **"All layers" baselines (solid lines):** `LapEigval` is highest (~0.89), followed by `AttnLogDet` (~0.845), then `AttnEigval` (~0.84).
* **Per-layer trends (dashed lines):** All three metrics show a general upward trend from layer 0 to layer 38, with significant volatility.
* `LapEigval` (orange dashed): Starts ~0.62, peaks near layer 14 (~0.79) and layer 32 (~0.80), with a notable dip around layer 24 (~0.66).
* `AttnEigval` (blue dashed): Follows a similar pattern to `LapEigval` but often slightly lower, starting ~0.61 and ending ~0.79.
* `AttnLogDet` (green dashed): Generally tracks below the other two per-layer metrics, starting ~0.63 and ending ~0.72.
**2. Llama3.2-3B**
* **"All layers" baselines:** `LapEigval` (~0.83) > `AttnEigval` (~0.805) > `AttnLogDet` (~0.80).
* **Per-layer trends:** Metrics are more tightly clustered and volatile than in Llama3.1-8B.
* All metrics start between 0.60-0.63.
* They show a general increase until around layer 12, followed by a period of fluctuation and a dip around layer 22 (lowest point ~0.63 for `AttnEigval`).
* A recovery occurs towards the final layers, with `AttnEigval` reaching the highest point (~0.75).
**3. Mistral-Nemo**
* **"All layers" baselines:** `LapEigval` (~0.86) > `AttnEigval` (~0.82) > `AttnLogDet` (~0.81).
* **Per-layer trends:** Shows the most distinct separation between metrics.
* `LapEigval` (orange dashed) is consistently the highest-performing per-layer metric, with a major peak at layer 16 (~0.76) and another at layer 36 (~0.78).
* `AttnEigval` (blue dashed) and `AttnLogDet` (green dashed) are lower and more intertwined, with `AttnLogDet` often being the lowest. Both show a significant dip around layer 22 (~0.60-0.61).
**4. Mistral-Small-24B**
* **"All layers" baselines:** `LapEigval` (~0.88) > `AttnEigval` (~0.845) > `AttnLogDet` (~0.835).
* **Per-layer trends:** Metrics are relatively stable and clustered in the 0.65-0.78 range.
* A gradual upward trend is visible from layer 0 to layer 38.
* `LapEigval` (orange dashed) frequently leads, with peaks around layer 20 (~0.78) and layer 34 (~0.78).
* `AttnLogDet` (green dashed) is often the lowest of the three, with a notable dip at layer 24 (~0.66).
**5. Phi3.5**
* **"All layers" baselines:** `LapEigval` (~0.87) > `AttnEigval` (~0.85) > `AttnLogDet` (~0.845).
* **Per-layer trends:** Shows a clear, steady upward trend for all metrics.
* All metrics start low (~0.67-0.68).
* They climb consistently, with `AttnEigval` (blue dashed) often taking the lead in the middle layers (e.g., layer 17 ~0.79).
* The final layers show a sharp increase, with `AttnEigval` reaching ~0.80 at layer 31.
### Key Observations
1. **Consistent Hierarchy of "All layers" Metrics:** Across all five models, the `LapEigval (all layers)` baseline (solid orange line) is always the highest, followed by `AttnEigval (all layers)` (solid blue), and then `AttnLogDet (all layers)` (solid green). This suggests that, when aggregated across all layers, the Laplacian Eigenvalue metric provides the strongest signal for the evaluated task.
2. **Per-Layer Volatility vs. Stability:** Per-layer metrics (dashed lines) are highly volatile and almost always perform worse than their "all layers" counterparts. This indicates that the diagnostic signal is distributed across layers and is noisier when examined in isolation.
3. **Model-Specific Patterns:**
* **Llama3.1-8B & Phi3.5:** Exhibit the clearest upward trends in per-layer performance, suggesting these models' layers become progressively more informative for the task.
* **Mistral-Nemo:** Shows the most distinct separation between the `LapEigval` per-layer metric and the others, highlighting its unique behavior in this model.
* **Common Dip:** Several models (Llama3.1-8B, Llama3.2-3B, Mistral-Nemo, Mistral-Small-24B) show a performance dip in per-layer metrics around layers 22-24, which could indicate a common architectural or functional transition point in these transformer models.
### Interpretation
This visualization is likely from a research paper investigating **internal model diagnostics** or **representation learning** in LLMs. The metrics (`AttnEigval`, `AttnLogDet`, `LapEigval`) are probably measures of the geometry or information content of the hidden states or attention matrices at each layer. The "Test AUROC" suggests these metrics are being used as features to classify or detect some property of the model's inputs or internal states (e.g., detecting hallucinations, adversarial examples, or task-specific features).
The key finding is that **aggregating information across all layers ("all layers" metrics) yields a much stronger and more stable diagnostic signal than examining any single layer in isolation.** The per-layer plots reveal the *internal landscape* of this signal, showing how the model's processing evolves. The upward trends in models like Phi3.5 suggest a hierarchical build-up of the measured property, while the volatility and dips in others may reflect specialized processing in different model regions. The consistent superiority of `LapEigval` implies that the spectral properties of the layer's representations (captured by eigenvalues of a Laplacian-like matrix) are particularly informative for the underlying task.
DECODING INTELLIGENCE...