## Scatter Plot: Accuracy vs. Time-to-Answer (Longest Thinking in Thousands)
### Overview
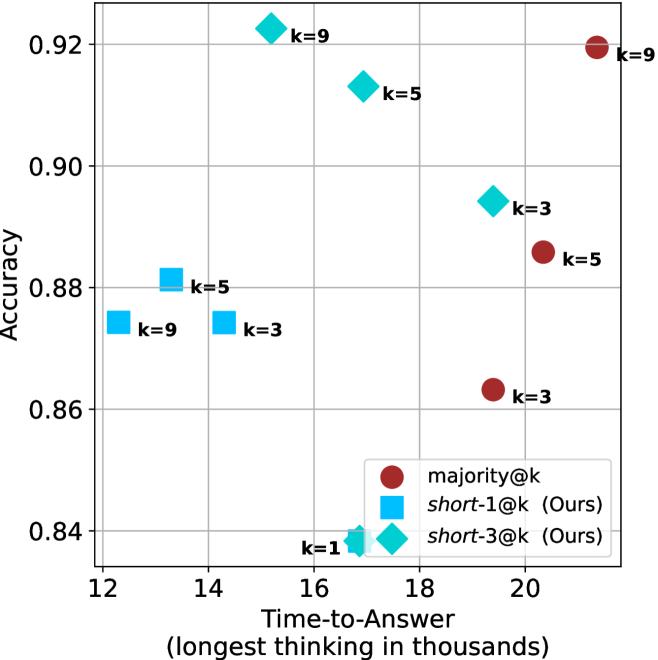
The image is a scatter plot comparing **Accuracy** (y-axis) and **Time-to-Answer (longest thinking in thousands)** (x-axis). Data points are color-coded and labeled with "k" values, representing different configurations or methods. The legend distinguishes three categories: **majority@k** (red circles), **short-1@k** (blue squares), and **short-3@k** (cyan diamonds). The plot highlights trade-offs between accuracy and computational time across configurations.
---
### Components/Axes
- **X-axis (Time-to-Answer)**: Labeled "Time-to-Answer (longest thinking in thousands)", ranging from **12 to 20** (in thousands of units).
- **Y-axis (Accuracy)**: Labeled "Accuracy", ranging from **0.84 to 0.92**.
- **Legend**: Located at the **bottom-right**, with three entries:
- **majority@k** (red circles)
- **short-1@k** (blue squares)
- **short-3@k** (cyan diamonds)
---
### Detailed Analysis
#### Data Points and Trends
1. **majority@k (Red Circles)**:
- High accuracy (0.86–0.92) with longer time-to-answer (16–20).
- Notable points:
- (20, 0.92) with **k=9**
- (18, 0.88) with **k=3**
- (16, 0.86) with **k=3**
2. **short-1@k (Blue Squares)**:
- Lower accuracy (0.84–0.88) with shorter time-to-answer (12–16).
- Notable points:
- (14, 0.88) with **k=9**
- (12, 0.88) with **k=3**
- (16, 0.84) with **k=1**
3. **short-3@k (Cyan Diamonds)**:
- Intermediate accuracy (0.84–0.91) with moderate time-to-answer (14–18).
- Notable points:
- (16, 0.91) with **k=5**
- (18, 0.89) with **k=3**
- (14, 0.84) with **k=1**
#### Key Observations
- **Trade-off**: Higher accuracy (majority@k) correlates with longer time-to-answer, while shorter methods (short-1@k, short-3@k) sacrifice accuracy for speed.
- **Outliers**:
- **k=9** (red circle at 20, 0.92) achieves the highest accuracy but requires the longest time.
- **k=1** (blue square at 16, 0.84) has the lowest accuracy among short-1@k.
- **Pattern**:
- **majority@k** dominates the upper-right quadrant (high accuracy, high time).
- **short-1@k** clusters in the lower-left (low accuracy, low time).
- **short-3@k** spans the middle, balancing accuracy and time.
---
### Interpretation
The data suggests a **trade-off between accuracy and computational efficiency**.
- **majority@k** prioritizes accuracy, likely using exhaustive methods (e.g., majority voting over multiple samples) but at the cost of time.
- **short-1@k** and **short-3@k** optimize for speed, possibly using truncated or simplified reasoning processes.
- **short-3@k** appears to strike a balance, achieving moderate accuracy with reduced time compared to majority@k.
- The **k=9** configuration (highest accuracy) may represent a "gold standard" but is impractical for real-time applications. Conversely, **k=1** (lowest accuracy) might indicate underpowered or overly simplified models.
This plot could inform decisions in systems requiring adaptive reasoning, where users might choose between accuracy and speed based on context (e.g., medical diagnosis vs. casual Q&A).