## Scatter Plot: Accuracy vs. Time-to-Answer
### Overview
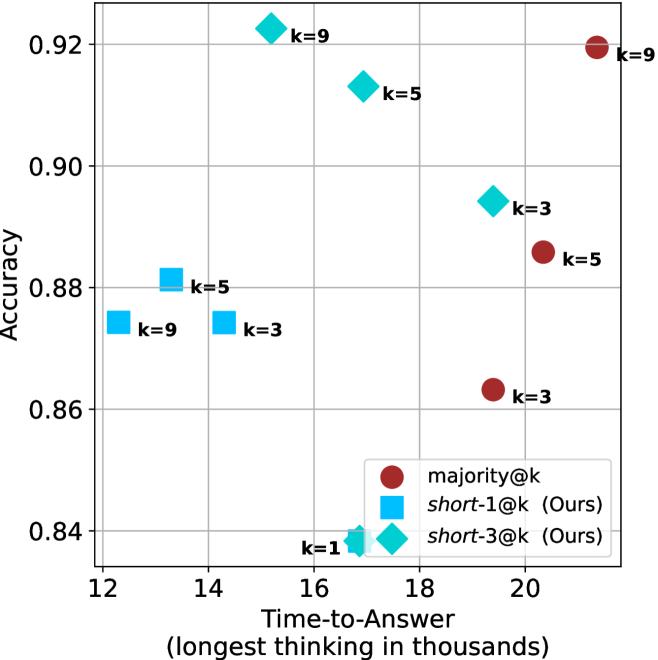
This image is a scatter plot comparing the performance of three different methods—`majority@k`, `short-1@k` (Ours), and `short-3@k` (Ours)—across varying `k` values. The plot evaluates the trade-off between "Time-to-Answer" (x-axis) and "Accuracy" (y-axis).
### Components/Axes
* **X-Axis:** "Time-to-Answer (longest thinking in thousands)". The scale ranges from 12 to 22.
* **Y-Axis:** "Accuracy". The scale ranges from 0.84 to 0.92.
* **Legend (Bottom-Right):**
* **Dark Red Circle:** `majority@k`
* **Cyan Square:** `short-1@k (Ours)`
* **Cyan Diamond:** `short-3@k (Ours)`
* **Grid:** A light gray grid overlays the plot area to assist in reading coordinate values.
### Detailed Analysis
The data points are grouped by method. Below are the extracted values based on visual estimation.
#### 1. `short-1@k` (Cyan Squares)
* **Trend:** This series occupies the left-most region of the chart, indicating the lowest time-to-answer. The accuracy fluctuates slightly as `k` increases.
* **Data Points:**
* `k=9`: x ≈ 12.2, y ≈ 0.875
* `k=5`: x ≈ 13.3, y ≈ 0.881
* `k=3`: x ≈ 14.3, y ≈ 0.875
* `k=1`: x ≈ 16.8, y ≈ 0.838 (Shared coordinate with `short-3@k`)
#### 2. `short-3@k` (Cyan Diamonds)
* **Trend:** This series shows a strong positive correlation between time and accuracy. As `k` increases from 1 to 9, both time and accuracy increase significantly.
* **Data Points:**
* `k=9`: x ≈ 15.3, y ≈ 0.923
* `k=5`: x ≈ 16.8, y ≈ 0.913
* `k=3`: x ≈ 19.4, y ≈ 0.894
* `k=1`: x ≈ 16.8, y ≈ 0.838 (Shared coordinate with `short-1@k`)
#### 3. `majority@k` (Dark Red Circles)
* **Trend:** This series occupies the right-most region of the chart, indicating the highest time-to-answer. Accuracy increases as `k` increases.
* **Data Points:**
* `k=9`: x ≈ 21.3, y ≈ 0.919
* `k=5`: x ≈ 20.3, y ≈ 0.886
* `k=3`: x ≈ 19.4, y ≈ 0.863
### Key Observations
* **Efficiency Leader:** `short-1@k` is consistently the fastest method (lowest x-values) but generally yields lower accuracy than `short-3@k`.
* **Performance Leader:** `short-3@k` at `k=9` achieves the highest accuracy on the chart (~0.923) while maintaining a significantly lower time-to-answer (~15.3) compared to `majority@k` at `k=9` (~21.3).
* **Convergence:** At `k=1`, both `short-1@k` and `short-3@k` converge to the exact same performance metrics (x ≈ 16.8, y ≈ 0.838).
* **Outlier/Anomaly:** The `majority@k` method is consistently slower than the "Ours" methods for equivalent `k` values, suggesting it is computationally more expensive.
### Interpretation
The data demonstrates a clear Pareto optimization strategy employed by the "Ours" methods (`short-1` and `short-3`).
1. **Efficiency vs. Accuracy:** The "Ours" methods are designed to reduce the "Time-to-Answer" compared to the baseline `majority@k`.
2. **Superiority of `short-3@k`:** The `short-3@k` method appears to be the most effective strategy presented. It achieves higher accuracy than `majority@k` (at `k=9`) while requiring roughly 28% less time (15.3 vs 21.3).
3. **Diminishing Returns:** While increasing `k` generally improves accuracy for all methods, it comes at a linear or near-linear cost in time. The `short-3@k` method provides the best balance, pushing the accuracy ceiling higher than the other two methods while keeping the time-to-answer well below the 20,000 mark for most configurations.