## Line Chart: 8x8 Gridworld: Sample Efficiency
### Overview
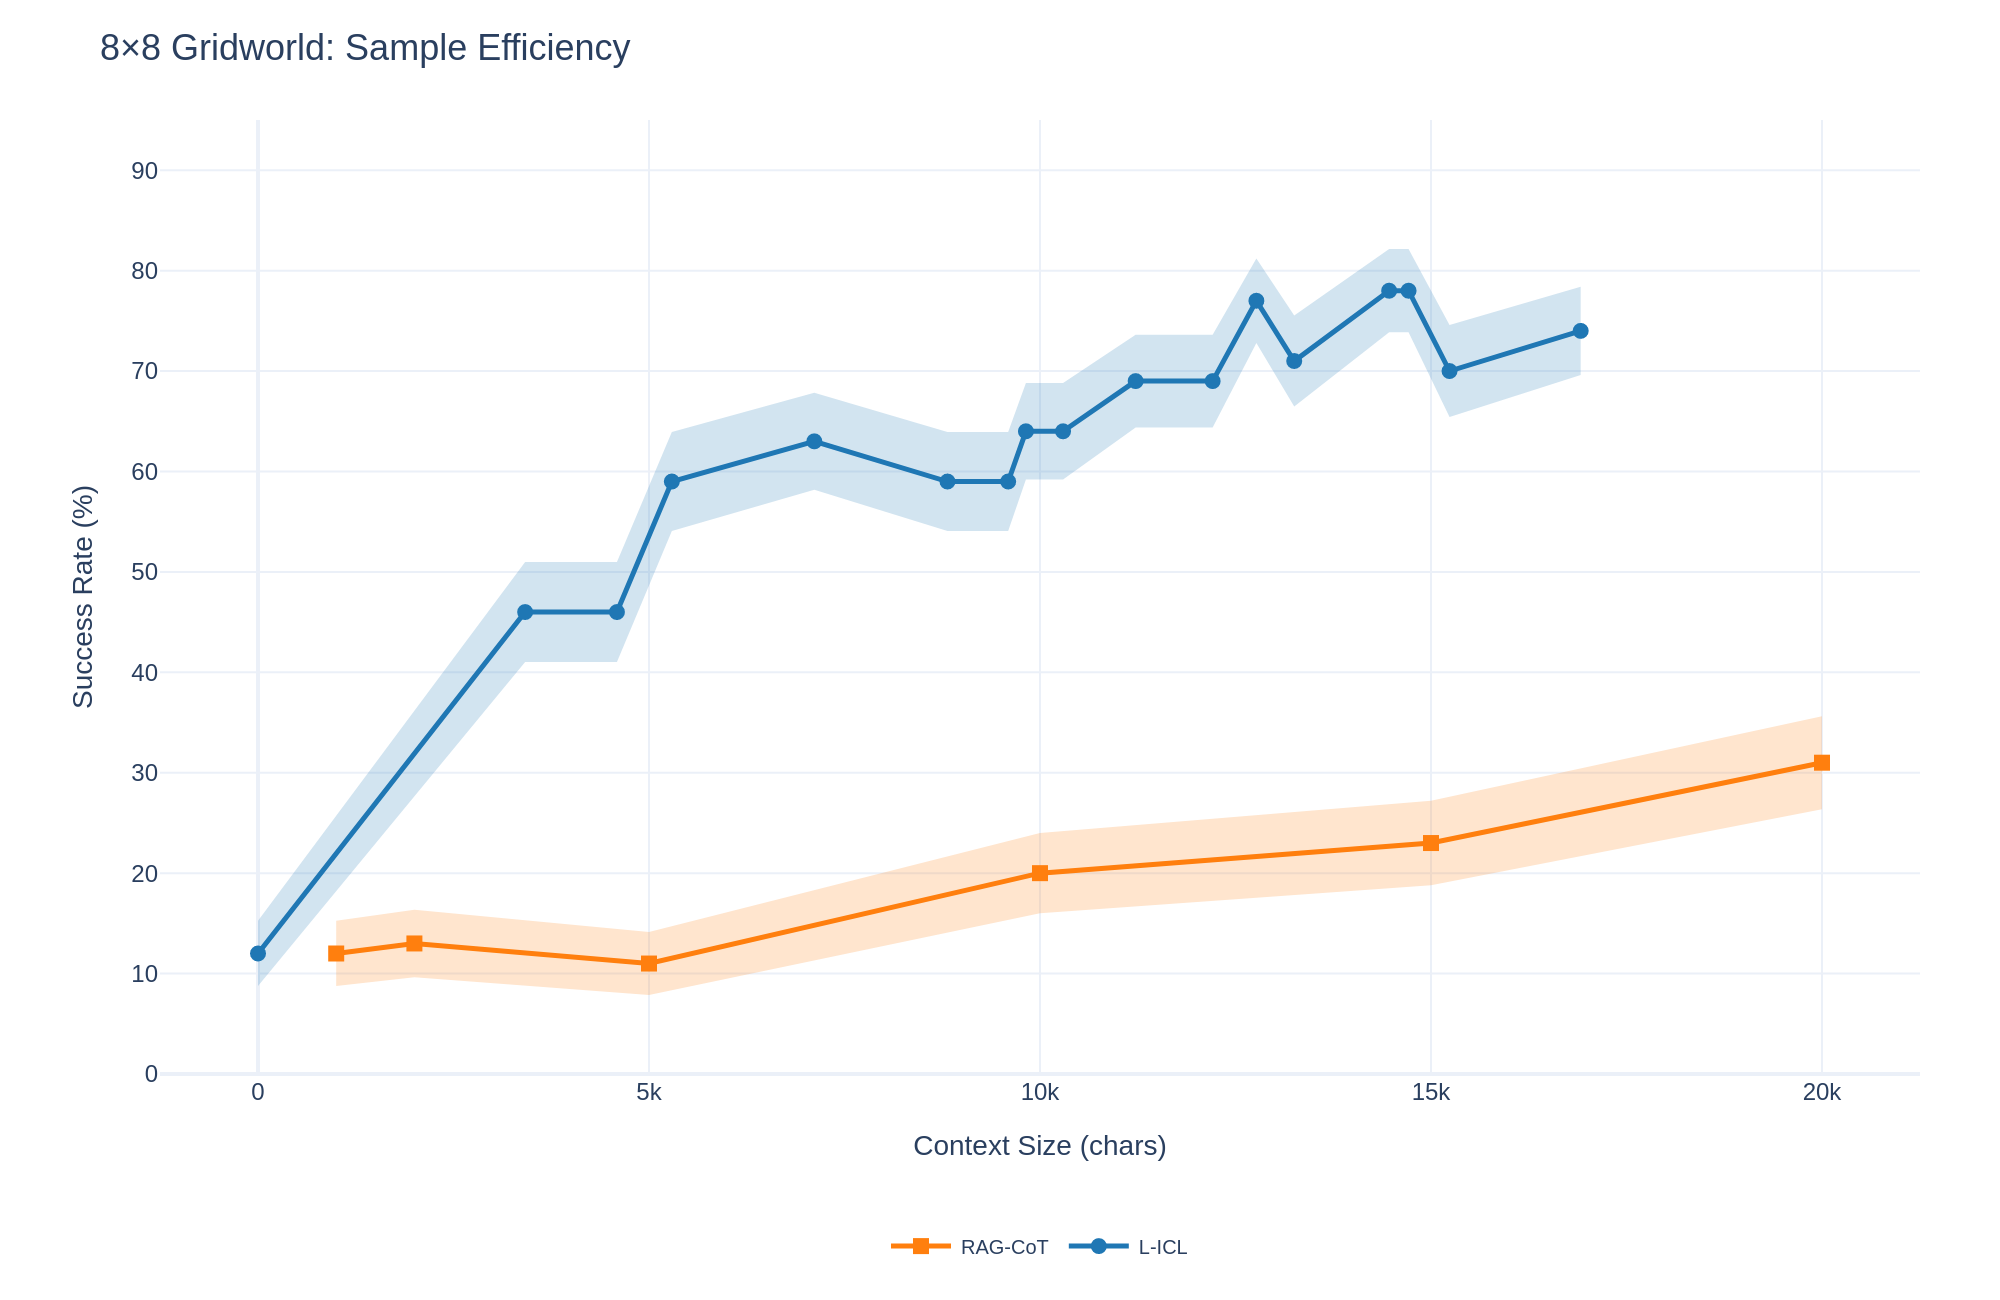
The image is a line chart comparing the sample efficiency of two methods, RAG-CoT and L-ICL, in an 8x8 Gridworld environment. The chart plots the success rate (in percentage) against the context size (in characters). Both lines have shaded regions around them, indicating a confidence interval or standard deviation.
### Components/Axes
* **Title:** 8x8 Gridworld: Sample Efficiency
* **X-axis:** Context Size (chars), with markers at 0, 5k, 10k, 15k, and 20k.
* **Y-axis:** Success Rate (%), with markers at 0, 10, 20, 30, 40, 50, 60, 70, 80, and 90.
* **Legend:** Located at the bottom of the chart.
* RAG-CoT (orange line with square markers)
* L-ICL (blue line with circle markers)
### Detailed Analysis
* **RAG-CoT (orange line):**
* The line starts at approximately 12% success rate at 0 context size.
* It dips slightly to around 11% at 5k context size.
* It then increases to approximately 20% at 10k context size.
* Continues to increase to approximately 23% at 15k context size.
* Reaches approximately 31% at 20k context size.
* The trend is generally upward, indicating increasing success rate with larger context size.
* **L-ICL (blue line):**
* The line starts at approximately 12% success rate at 0 context size.
* It increases sharply to approximately 46% at 5k context size.
* It plateaus around 60-65% between 5k and 10k context size.
* It fluctuates between 70% and 80% between 10k and 15k context size.
* It ends at approximately 74% at 20k context size.
* The trend is initially sharply upward, then plateaus with some fluctuations, indicating a higher success rate compared to RAG-CoT, especially with larger context sizes.
### Key Observations
* L-ICL consistently outperforms RAG-CoT across all context sizes.
* L-ICL shows a significant initial improvement in success rate with increasing context size, while RAG-CoT's improvement is more gradual.
* The shaded regions around the lines suggest that the variance in success rate is higher for L-ICL than for RAG-CoT, especially at larger context sizes.
### Interpretation
The chart demonstrates that L-ICL is more sample efficient than RAG-CoT in the 8x8 Gridworld environment. This means that L-ICL achieves a higher success rate with the same amount of context. The initial sharp increase in L-ICL's success rate suggests that it benefits more from the initial context provided, while RAG-CoT requires a larger context size to achieve comparable performance. The fluctuations in L-ICL's success rate at larger context sizes could indicate that it is more sensitive to the specific context provided, leading to higher variance in performance. The data suggests that L-ICL is a better choice for this task, especially when context size is limited.