## Line Chart: Question Importance Score vs. Reasoning Step
### Overview
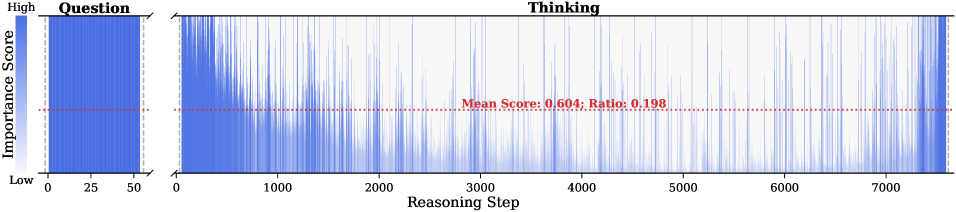
The image presents a line chart that visualizes the importance score of a question during a reasoning process. The chart is divided into two sections: a vertical bar on the left representing the initial question importance, and a larger section on the right showing how the importance score changes over reasoning steps.
### Components/Axes
* **Title:** "Thinking" (located at the top-center of the chart)
* **Left Section:**
* **Title:** "Question" (located at the top-left of the chart)
* **Y-axis Label:** "Importance Score" (vertical, rotated 90 degrees counter-clockwise)
* **Y-axis Scale:** "High" (at the top), "Low" (at the bottom)
* **X-axis Markers:** 0, 25, 50
* **Right Section:**
* **X-axis Label:** "Reasoning Step"
* **X-axis Markers:** 0, 1000, 2000, 3000, 4000, 5000, 6000, 7000
* **Data Series:** Multiple overlapping blue lines representing the importance score at each reasoning step.
* **Horizontal Dotted Red Line:** Indicates the "Mean Score: 0.604; Ratio: 0.198"
### Detailed Analysis
* **Question Importance (Left Section):**
* The vertical bar representing the initial question importance is filled with blue lines.
* The density of the blue lines suggests a high initial importance score, concentrated near the "High" end of the "Importance Score" axis.
* The lines span from approximately 0 to 50 on the x-axis.
* **Importance Score over Reasoning Steps (Right Section):**
* The blue lines show the fluctuation of the importance score over the reasoning steps.
* **Trend:** The lines generally decrease in density as the reasoning step increases, indicating a decreasing importance score over time.
* The lines start with a high density at the beginning (Reasoning Step 0) and gradually spread out and decrease in density as the reasoning step increases.
* The horizontal red dotted line represents the mean score (0.604) and ratio (0.198).
### Key Observations
* The initial question importance is high.
* The importance score tends to decrease as the reasoning process progresses.
* There is significant variability in the importance score at each reasoning step, as indicated by the spread of the blue lines.
* The mean score provides a reference point for the average importance score throughout the reasoning process.
### Interpretation
The chart suggests that the initial question is considered highly important at the beginning of the reasoning process. However, as the reasoning progresses, the importance of the initial question tends to decrease. This could indicate that the reasoning process is exploring different aspects or sub-questions, leading to a shift in focus away from the initial question. The variability in the importance score at each step suggests that the reasoning process is not linear and involves revisiting or re-evaluating the importance of the initial question at different stages. The mean score and ratio provide a quantitative measure of the overall importance of the question throughout the reasoning process.