\n
## Heatmap/Bar Chart: Importance Score Across Reasoning Steps
### Overview
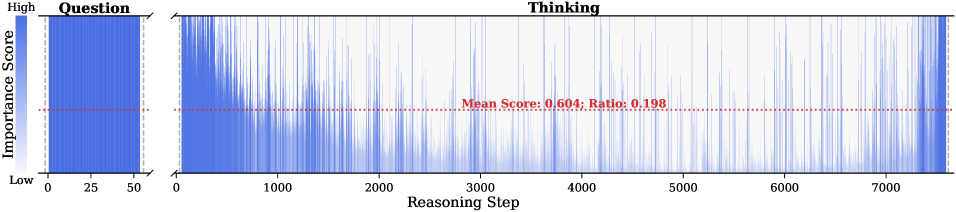
The image displays a two-part chart visualizing the "Importance Score" (y-axis) across different stages of a process, divided into a "Question" phase and a "Thinking" phase. The chart uses a blue color intensity scale to represent score magnitude, with a horizontal red dashed line indicating a mean value.
### Components/Axes
* **Y-Axis (Vertical):** Labeled **"Importance Score"**. The scale is qualitative, marked with **"High"** at the top and **"Low"** at the bottom. No numerical scale is provided.
* **X-Axis (Horizontal):** Represents a sequence or timeline, split into two distinct sections:
1. **Left Section ("Question"):** X-axis markers at **0, 25, 50**. This section is a solid, dense blue block.
2. **Right Section ("Thinking"):** X-axis labeled **"Reasoning Step"** with markers at **0, 1000, 2000, 3000, 4000, 5000, 6000, 7000**. This section shows a fluctuating line/area graph.
* **Legend/Key:** There is no separate legend box. The color blue directly maps to the "Importance Score" value, with darker/denser blue indicating a higher score.
* **Annotation:** A horizontal red dashed line spans the "Thinking" section. Centered text on this line reads: **"Mean Score: 0.604; Ratio: 0.198"**.
### Detailed Analysis
* **"Question" Phase (Steps 0-50):** This region is a uniform, solid blue block extending from the "Low" to the "High" mark on the y-axis. This indicates that throughout the initial 50 steps (presumably related to processing or understanding the question), the importance score is consistently at or near the maximum value.
* **"Thinking" Phase (Steps 0-7000+):** This region shows a highly variable blue line/area graph.
* **Trend:** The graph exhibits frequent, sharp peaks and troughs. There is no single overarching upward or downward trend across the entire 7000 steps. Instead, it shows bursts of high importance (tall blue spikes) interspersed with periods of lower importance (shorter blue spikes or valleys).
* **Data Points:** Precise numerical values for each step cannot be extracted as the y-axis is not numerically scaled. However, visually, many spikes reach near the "High" level, while the baseline frequently drops to near the "Low" level.
* **Mean Score Line:** The red dashed line provides a quantitative reference. The **"Mean Score: 0.604"** suggests that, on a normalized scale (likely 0 to 1), the average importance across the "Thinking" steps is approximately 0.604, which is moderately high.
* **Ratio:** The **"Ratio: 0.198"** is provided without explicit context. It may represent the proportion of steps that exceed the mean score, the ratio of high-importance to low-importance steps, or another derived metric. Visually, the dense clustering of spikes makes it difficult to confirm this ratio precisely from the graph alone.
### Key Observations
1. **Phase Dichotomy:** There is a stark contrast between the "Question" and "Thinking" phases. The "Question" phase is uniformly high-importance, while the "Thinking" phase is characterized by volatility.
2. **Bursty Importance:** The "Thinking" process does not maintain a steady level of importance. Instead, it appears to have discrete moments or intervals of high cognitive salience (the tall spikes).
3. **Quantitative Anchor:** The mean score (0.604) serves as the only precise numerical data point, indicating the central tendency of importance during the reasoning phase is above the midpoint.
4. **Spatial Layout:** The "Question" section occupies the leftmost ~7% of the chart's width (0-50 vs. 0-7000+), visually emphasizing that the bulk of the process (in terms of step count) is the "Thinking" phase.
### Interpretation
This chart likely visualizes the output of an analytical model assessing the importance of different tokens or steps in a language model's reasoning chain. The **"Question" phase** being uniformly high suggests that every part of the initial query is deemed critical for setting the context. The **"Thinking" phase** reveals the model's internal reasoning process: it is not a smooth, equally-weighted deduction but a series of focused, high-importance computations (the spikes) connected by less critical transitional or integrative steps (the valleys).
The **Mean Score of 0.604** indicates that, on average, the reasoning steps carry substantial weight. The **Ratio of 0.198** is particularly intriguing. If interpreted as the fraction of steps with high importance, it suggests that only about 20% of the reasoning steps are truly pivotal, while the remaining 80% play a supporting role. This aligns with the visual "bursty" pattern. The chart demonstrates that effective reasoning, as modeled here, is not about constant high effort but about strategically deploying high-importance processing at key junctures.