TECHNICAL ASSET FINGERPRINT
a825f5f00e51365c0061e8b1
Click to view fullscreen
Press ESC or click to close
FOUND IN PAPERS
EXPERT: healer-alpha-free VERSION 1
RUNTIME: free/openrouter/healer-alpha
INTEL_VERIFIED
## Scatter Plot Matrix: Token Embeddings in Principal Component Space
### Overview
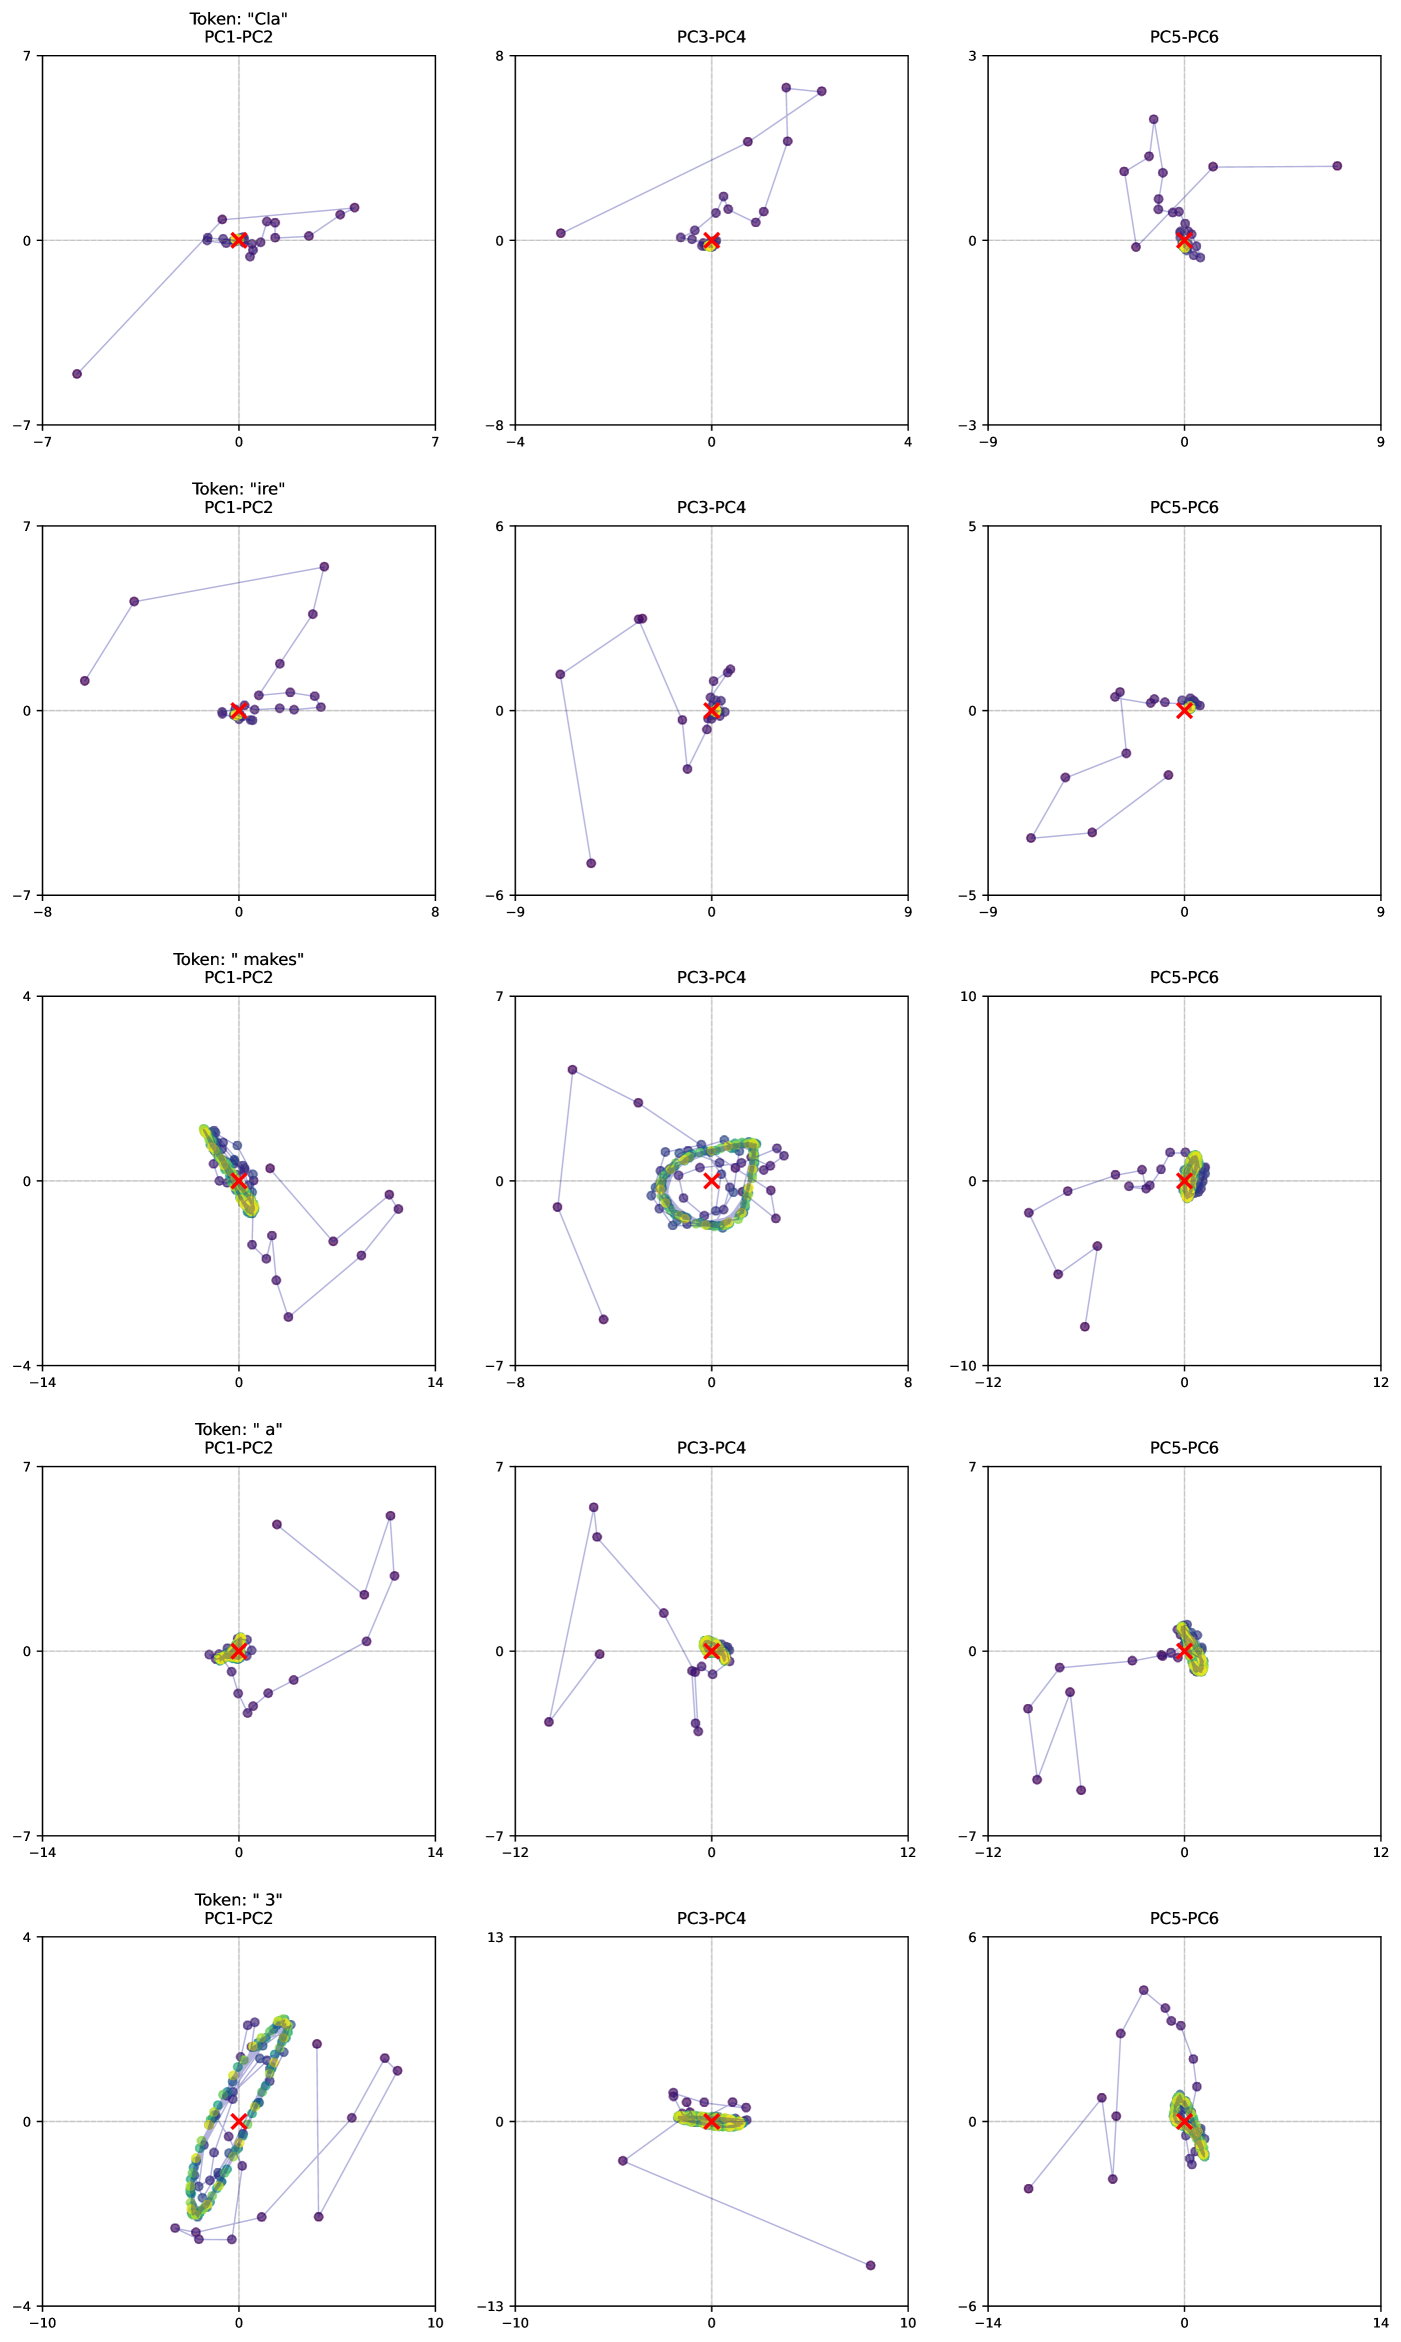
The image displays a 5x3 grid of scatter plots, visualizing the trajectories or distributions of five different text tokens within a reduced-dimensional space defined by Principal Component Analysis (PCA). Each row corresponds to a specific token, and each column shows a different pair of principal components (PC1-PC2, PC3-PC4, PC5-PC6). The plots appear to track the evolution or variance of token embeddings, possibly across layers, training steps, or different contexts. Data points are connected by lines, suggesting a sequential or iterative process.
### Components/Axes
* **Grid Structure:** 5 rows (Tokens) x 3 columns (PC Pairs).
* **Row Labels (Token):**
* Row 1: Token: "Cla"
* Row 2: Token: "ire"
* Row 3: Token: "makes"
* Row 4: Token: "a"
* Row 5: Token: "3"
* **Column Labels (Principal Component Pairs):**
* Column 1: PC1-PC2
* Column 2: PC3-PC4
* Column 3: PC5-PC6
* **Axes:** Each subplot has an x-axis and y-axis corresponding to the labeled principal components (e.g., PC1 on x, PC2 on y for the first column). The numerical ranges vary per plot.
* **Visual Elements:**
* **Data Points:** Represented as small circles. Colors include purple, green, and yellow, likely indicating different series, iterations, or clusters.
* **Connecting Lines:** Thin, light purple lines connect the data points in sequence within each plot.
* **Origin Marker:** A red 'X' is placed at the coordinate (0,0) in every subplot, serving as a fixed reference point.
### Detailed Analysis
**Row 1: Token "Cla"**
* **PC1-PC2 (Range: x≈[-7,7], y≈[-7,7]):** A sparse, elongated trajectory. Points start near the origin, extend to the lower-left quadrant (approx. -6, -6), and also to the upper-right quadrant (approx. 5, 2). The path is not tightly clustered.
* **PC3-PC4 (Range: x≈[-4,4], y≈[-8,8]):** A more scattered, upward-trending path. Points move from near the origin to the upper-right (approx. 3, 7) and also to the lower-left (approx. -3, 0).
* **PC5-PC6 (Range: x≈[-9,9], y≈[-3,3]):** A path that spreads horizontally. Points are found in the left half (x negative) and a distinct point far to the right (approx. 8, 1).
**Row 2: Token "ire"**
* **PC1-PC2 (Range: x≈[-8,8], y≈[-7,7]):** A wide, arching trajectory. Points form a large loop from the lower-left (approx. -7, 1) up to the upper-right (approx. 6, 6) and back towards the center.
* **PC3-PC4 (Range: x≈[-9,9], y≈[-6,6]):** A jagged, downward-then-upward path. A notable point is in the lower-left (approx. -7, -5). The cluster near the origin is denser.
* **PC5-PC6 (Range: x≈[-9,9], y≈[-5,5]):** A path primarily in the left and lower quadrants, with points extending to (approx. -8, -4) and (approx. -4, -2).
**Row 3: Token "makes"**
* **PC1-PC2 (Range: x≈[-14,14], y≈[-4,4]):** Shows two distinct clusters. A dense, multi-colored (green/yellow/purple) cluster is centered slightly left of the origin. A separate, sparse purple trajectory extends far to the right (x up to ~13) and down (y down to ~-3).
* **PC3-PC4 (Range: x≈[-8,8], y≈[-7,7]):** Features a very dense, circular cluster of green/yellow points centered near the origin. A separate purple trajectory extends to the lower-left (approx. -6, -6).
* **PC5-PC6 (Range: x≈[-12,12], y≈[-10,10]):** A dense cluster near the origin, with a purple trajectory extending to the lower-left (approx. -9, -8).
**Row 4: Token "a"**
* **PC1-PC2 (Range: x≈[-14,14], y≈[-7,7]):** A dense cluster near the origin, with a sparse purple trajectory extending to the upper-right (approx. 12, 6) and lower-right (approx. 13, -2).
* **PC3-PC4 (Range: x≈[-12,12], y≈[-7,7]):** A dense cluster at the origin, with a sparse trajectory forming a large, irregular shape in the left half of the plot.
* **PC5-PC6 (Range: x≈[-12,12], y≈[-7,7]):** A dense cluster at the origin, with a sparse trajectory extending into the left and lower-left quadrants.
**Row 5: Token "3"**
* **PC1-PC2 (Range: x≈[-10,10], y≈[-4,4]):** A dense, elongated cluster of green/yellow points oriented diagonally from lower-left to upper-right, centered near the origin. A separate purple trajectory extends to the right.
* **PC3-PC4 (Range: x≈[-10,10], y≈[-13,13]):** A very flat, dense cluster of green/yellow points along the x-axis near the origin. A sparse purple trajectory extends to the lower-right (approx. 9, -12).
* **PC5-PC6 (Range: x≈[-14,14], y≈[-6,6]):** A dense cluster at the origin, with a sparse trajectory forming an arch in the upper half of the plot.
### Key Observations
1. **Token-Specific Patterns:** Each token exhibits a unique "fingerprint" across the six principal components. "makes" and "3" show particularly dense, localized clusters in some PC pairs, while "Cla" and "ire" show more dispersed trajectories.
2. **Cluster vs. Trajectory:** For tokens "makes", "a", and "3", there is a clear visual separation between a dense, multi-colored cluster (often green/yellow) centered near the origin and a sparser, purple trajectory that wanders further away. This suggests two distinct modes or states in the data.
3. **Axis Range Variation:** The scale of the axes differs significantly between plots (e.g., PC3-PC4 for token "3" has a y-range of [-13,13], while for token "Cla" it's [-8,8]). This indicates the variance captured by each PC pair is token-dependent.
4. **Origin as Anchor:** The red 'X' at (0,0) is a consistent reference. Dense clusters are frequently anchored at or very near this origin point.
### Interpretation
This visualization likely represents the **evolution of token embeddings** within a neural network (e.g., across layers or during training) projected into a PCA-reduced space. The principal components (PC1 through PC6) capture the directions of greatest variance in the high-dimensional embedding space.
* **What the data suggests:** The dense clusters (green/yellow) near the origin may represent a stable, converged, or "default" state for the token's representation. The wandering purple trajectories could represent the token's embedding as it is processed through different contexts, layers, or training iterations, showing how it moves through the semantic space defined by the PCs.
* **Relationship between elements:** The separation between the dense cluster and the sparse trajectory for some tokens implies a dichotomy—perhaps between a contextualized and decontextualized embedding, or between early and late processing stages. The unique shape for each token indicates that different words or symbols navigate this latent space in distinct ways.
* **Notable anomalies:** The token "3" (a digit) shows an extremely flat cluster in PC3-PC4, suggesting very low variance in those specific directions compared to its variance in PC1-PC2. The token "makes" (a verb) shows one of the most expansive trajectories in PC1-PC2, possibly reflecting its high functional variability in language.
* **Underlying meaning:** This type of analysis is crucial for **interpretability in AI**. It helps researchers understand how a model internally represents and transforms different linguistic units. The distinct patterns could correlate with grammatical category, semantic role, or frequency. The movement away from the origin might visualize the process of "contextualization" as a token is integrated into a specific sentence meaning.
DECODING INTELLIGENCE...