# Technical Data Extraction: Control Effect Analysis in Large Language Models
This document provides a comprehensive extraction of the data and trends presented in the provided image, which consists of four primary panels (a, b, c, and d) analyzing the "Control effect (d)" across different model configurations and training examples.
---
## Panel (a): Score Distributions (Histograms)
This section contains two histograms showing the frequency of scores for two classes: "Imitate <0>" (Blue) and "Imitate <1>" (Orange).
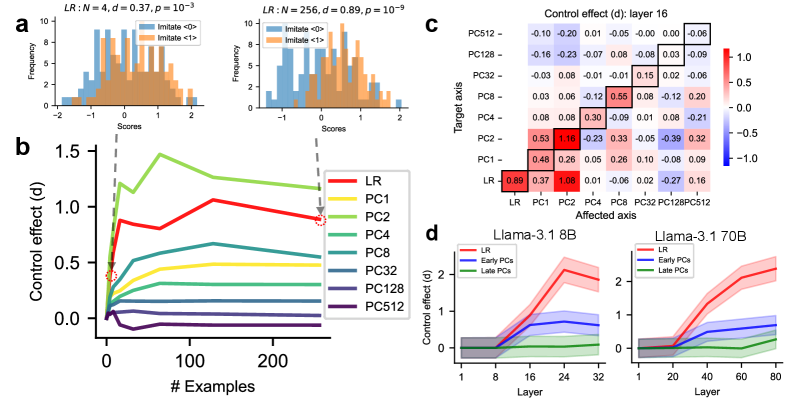
### Left Histogram: $LR : N = 4, d = 0.37, p = 10^{-3}$
* **X-axis:** Scores (Range: -2 to 2)
* **Y-axis:** Frequency (Range: 0 to 10)
* **Trend:** The distributions for <0> and <1> show significant overlap. The blue distribution is slightly shifted left, and the orange is slightly shifted right.
* **Key Data:** At $N=4$ examples, the control effect ($d$) is low at 0.37.
### Right Histogram: $LR : N = 256, d = 0.89, p = 10^{-9}$
* **X-axis:** Scores (Range: -1 to 2)
* **Y-axis:** Frequency (Range: 0 to 10)
* **Trend:** The distributions are more distinct compared to the left plot. The blue distribution (<0>) is centered around -0.5, while the orange distribution (<1>) is centered around 0.5.
* **Key Data:** At $N=256$ examples, the control effect ($d$) increases significantly to 0.89 with high statistical significance ($p = 10^{-9}$).
---
## Panel (b): Control Effect vs. Number of Examples
A line graph showing how the control effect ($d$) evolves as the number of training examples increases.
### Metadata
* **X-axis:** # Examples (Scale: 0, 100, 200)
* **Y-axis:** Control effect (d) (Scale: 0.0, 0.5, 1.0, 1.5)
* **Legend Location:** Right-center
### Data Series Trends and Values
| Series Label | Color | Visual Trend | Final Value (approx. N=256) |
| :--- | :--- | :--- | :--- |
| **LR** | Red | Sharp initial rise, stabilizes around 0.9 | ~0.89 |
| **PC1** | Yellow | Steady rise, stabilizes below LR | ~0.5 |
| **PC2** | Light Green | Highest peak (~1.5 at N=50), then declines | ~1.2 |
| **PC4** | Green | Moderate rise, stabilizes | ~0.3 |
| **PC8** | Teal | Slight rise, stabilizes | ~0.15 |
| **PC32** | Blue-Grey | Flat/Near zero | ~0.1 |
| **PC128** | Purple | Flat/Near zero | ~0.0 |
| **PC512** | Dark Purple | Slight dip below zero, then flat | ~-0.1 |
**Spatial Grounding Note:** Dashed grey lines connect the LR data points at $N=4$ and $N=256$ to the histograms in Panel (a).
---
## Panel (c): Heatmap - Control effect (d): layer 16
A matrix representing the interaction between "Affected axis" and "Target axis".
### Axis Labels
* **X-axis (Affected axis):** LR, PC1, PC2, PC4, PC8, PC32, PC128, PC512
* **Y-axis (Target axis):** LR, PC1, PC2, PC4, PC8, PC32, PC128, PC512
* **Color Scale:** Blue (-1.0) to White (0.0) to Red (1.0).
### Key Data Points (Diagonal and High Values)
The diagonal (bottom-left to top-right) is outlined in black, representing self-influence.
* **LR/LR:** 0.89 (Strong positive)
* **PC1/PC1:** 0.26
* **PC2/PC2:** 1.16 (Strongest effect in the matrix)
* **PC4/PC4:** 0.30
* **PC8/PC8:** 0.55
* **PC32/PC32:** 0.15
* **PC128/PC128:** 0.03
* **PC512/PC512:** -0.06
* **Notable Off-diagonal:** PC2 (Affected) on LR (Target) is **1.08**. PC1 (Affected) on PC2 (Target) is **0.53**.
---
## Panel (d): Control Effect by Layer
Two line graphs comparing Llama-3.1 8B and 70B models. Shaded areas represent confidence intervals.
### Llama-3.1 8B
* **X-axis:** Layer (1 to 32)
* **Y-axis:** Control effect (d) (0 to 2)
* **LR (Red):** Starts at 0, rises sharply after layer 8, peaks at layer 24 (~2.1), then slightly declines.
* **Early PCs (Blue):** Rises after layer 8, plateaus around 0.7.
* **Late PCs (Green):** Remains near 0 for all layers.
### Llama-3.1 70B
* **X-axis:** Layer (1 to 80)
* **Y-axis:** Control effect (d) (0 to 2)
* **LR (Red):** Starts at 0, rises steadily after layer 20, reaching ~2.3 at layer 80.
* **Early PCs (Blue):** Rises after layer 20, plateaus around 0.6.
* **Late PCs (Green):** Remains near 0 until layer 60, then shows a very slight increase to ~0.2.