## Line Graph: Proportion of IPD > IPD_max vs Frequency [kHz]
### Overview
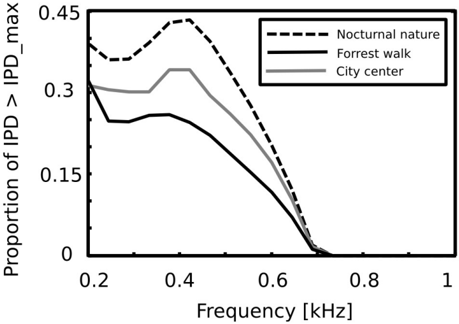
The graph displays three frequency-dependent trends in the proportion of IPD (Interaural Phase Difference) exceeding a maximum threshold (IPD_max) across three environments: Nocturnal nature, Forrest walk, and City center. The y-axis represents the proportion (0–0.45), and the x-axis represents frequency (0.2–1 kHz). All lines converge near 0.8 kHz, suggesting a shared attenuation pattern at higher frequencies.
### Components/Axes
- **Y-axis**: "Proportion of IPD > IPD_max" (0 to 0.45, linear scale).
- **X-axis**: "Frequency [kHz]" (0.2 to 1, linear scale).
- **Legend**: Located in the top-right corner, with three entries:
- Dashed line: Nocturnal nature
- Solid black line: Forrest walk
- Solid gray line: City center
### Detailed Analysis
1. **Nocturnal nature (dashed line)**:
- Starts at ~0.3 at 0.2 kHz.
- Peaks at ~0.45 at ~0.4 kHz.
- Declines sharply to ~0.1 at ~0.6 kHz.
- Drops to near 0 by 0.8 kHz.
2. **Forrest walk (solid black line)**:
- Begins at ~0.25 at 0.2 kHz.
- Peaks at ~0.35 at ~0.3 kHz.
- Declines to ~0.15 at ~0.5 kHz.
- Reaches ~0.05 at 0.8 kHz.
3. **City center (solid gray line)**:
- Starts at ~0.3 at 0.2 kHz.
- Peaks at ~0.3 at ~0.35 kHz.
- Declines to ~0.1 at ~0.5 kHz.
- Drops to ~0.02 at 0.8 kHz.
### Key Observations
- **Nocturnal nature** exhibits the highest initial proportion and widest frequency range before attenuation.
- **Forrest walk** and **City center** show similar peak proportions (~0.35 and ~0.3, respectively) but differ in frequency of peak occurrence.
- All lines converge near 0.8 kHz, indicating a shared threshold for IPD_max attenuation across environments.
- Nocturnal nature’s peak (~0.45) is ~50% higher than Forrest walk’s peak (~0.35).
### Interpretation
The data suggests that **Nocturnal nature** environments produce more variable or extreme IPD values compared to urban or forested settings. The sharp decline in all lines after ~0.5 kHz implies that higher frequencies are less likely to exceed IPD_max thresholds, possibly due to environmental noise masking or sound attenuation mechanisms. The City center’s flatter initial slope may reflect consistent anthropogenic noise, while the Forrest walk’s earlier peak could indicate natural sound variability (e.g., wind, animal activity). The convergence at high frequencies highlights a universal acoustic property across environments, potentially relevant for auditory perception studies or noise pollution modeling.