## Line Chart: EGA vs. Environment Step for Different Initial Conditions
### Overview
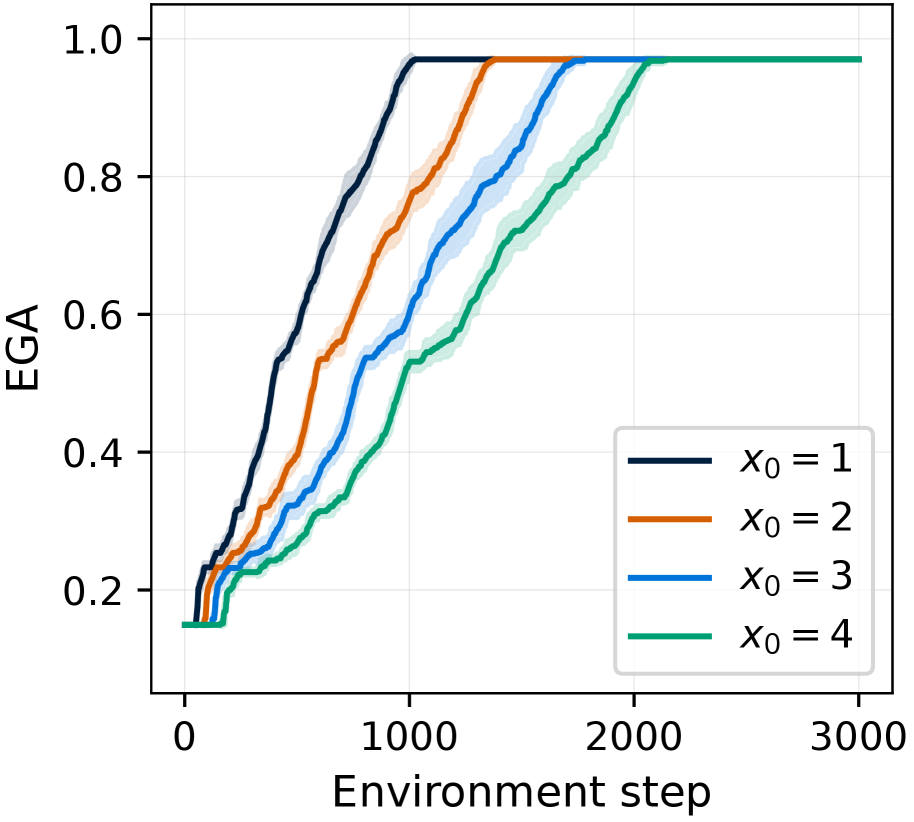
The image is a line chart displaying the performance metric "EGA" over the course of "Environment step" for four different initial conditions, denoted as \(x_0\). Each condition is represented by a distinct colored line with a shaded region around it, likely indicating variance or confidence intervals. All lines show an upward trend that eventually plateaus at the maximum value of 1.0, but at different rates.
### Components/Axes
* **Chart Type:** Line chart with shaded error bands.
* **X-Axis:**
* **Label:** "Environment step"
* **Scale:** Linear, ranging from 0 to 3000.
* **Major Tick Marks:** 0, 1000, 2000, 3000.
* **Y-Axis:**
* **Label:** "EGA"
* **Scale:** Linear, ranging from 0.0 to 1.0.
* **Major Tick Marks:** 0.0, 0.2, 0.4, 0.6, 0.8, 1.0.
* **Legend:**
* **Position:** Bottom-right corner of the plot area.
* **Content:** Four entries, each associating a color with an initial condition.
* Dark Blue Line: \(x_0 = 1\)
* Orange Line: \(x_0 = 2\)
* Light Blue Line: \(x_0 = 3\)
* Green Line: \(x_0 = 4\)
* **Grid:** A light gray grid is present in the background.
### Detailed Analysis
**Trend Verification & Data Points:**
All four data series begin at approximately the same starting point on the y-axis (EGA ≈ 0.15) at Environment step 0. They all follow a sigmoidal (S-shaped) growth curve, rising steeply before leveling off at EGA = 1.0. The primary difference is the speed of convergence.
1. **\(x_0 = 1\) (Dark Blue Line):**
* **Trend:** Steepest initial ascent. Reaches the plateau (EGA ≈ 1.0) first.
* **Approximate Key Points:** Starts at ~0.15. Crosses EGA=0.5 at ~step 400. Crosses EGA=0.8 at ~step 800. Reaches and stabilizes at 1.0 by approximately step 1000.
2. **\(x_0 = 2\) (Orange Line):**
* **Trend:** Second steepest ascent. Follows a similar shape to the dark blue line but is shifted to the right (slower).
* **Approximate Key Points:** Starts at ~0.15. Crosses EGA=0.5 at ~step 600. Crosses EGA=0.8 at ~step 1100. Reaches and stabilizes at 1.0 by approximately step 1400.
3. **\(x_0 = 3\) (Light Blue Line):**
* **Trend:** Third steepest ascent. Noticeably slower than the first two.
* **Approximate Key Points:** Starts at ~0.15. Crosses EGA=0.5 at ~step 800. Crosses EGA=0.8 at ~step 1500. Reaches and stabilizes at 1.0 by approximately step 1800.
4. **\(x_0 = 4\) (Green Line):**
* **Trend:** Slowest ascent of the four series.
* **Approximate Key Points:** Starts at ~0.15. Crosses EGA=0.5 at ~step 1000. Crosses EGA=0.8 at ~step 1800. Reaches and stabilizes at 1.0 by approximately step 2200.
**Shaded Regions:** Each line is surrounded by a semi-transparent shaded band of the same color. The width of these bands appears relatively consistent across all lines and throughout their ascent, suggesting a stable level of variance or uncertainty in the EGA measurement at each step.
### Key Observations
1. **Clear Inverse Relationship:** There is a direct, inverse relationship between the initial condition value \(x_0\) and the rate of learning/performance improvement. A lower \(x_0\) leads to faster convergence to the maximum EGA.
2. **Identical Starting and Ending Points:** All conditions start at the same low performance level and ultimately achieve the same perfect performance (EGA=1.0). The variable is solely the *speed* of achievement.
3. **Consistent Variance:** The shaded error bands do not dramatically widen or narrow, indicating that the variability in performance between different runs (or within the measurement) for a given \(x_0\) is fairly constant over time.
4. **No Performance Degradation:** Once a line reaches the plateau at EGA=1.0, it remains stable for the remainder of the observed steps (up to 3000), showing no signs of decline or instability.
### Interpretation
This chart likely visualizes results from a reinforcement learning or optimization experiment. "EGA" is probably a performance metric (e.g., "Expected Goal Achievement," "Episodic Goal Accuracy") where 1.0 represents optimal or successful task completion. "Environment step" represents the number of interactions or training iterations.
The data demonstrates that the **initial state or condition (\(x_0\)) of the agent or system is a critical factor determining learning efficiency**. The system with the most favorable initial condition (\(x_0=1\)) masters the task in roughly half the time (steps) required by the system with the least favorable condition (\(x_0=4\)). This suggests that the problem landscape may have a gradient that is easier to navigate from certain starting points, or that \(x_0\) represents a parameter like initial knowledge, resource level, or proximity to a goal.
The consistent variance (shaded bands) implies that the learning process is stochastic but reliable; while individual runs may vary, the overall trajectory for a given \(x_0\) is predictable. The eventual convergence of all lines to 1.0 indicates that the task is solvable from all tested initial conditions, given sufficient experience. The key practical insight is that investing resources to place a system in a better initial state (\(x_0=1\)) can dramatically reduce the training time or sample complexity required to achieve peak performance.