## Screenshot: Aerial View with Object Detection Annotations
### Overview
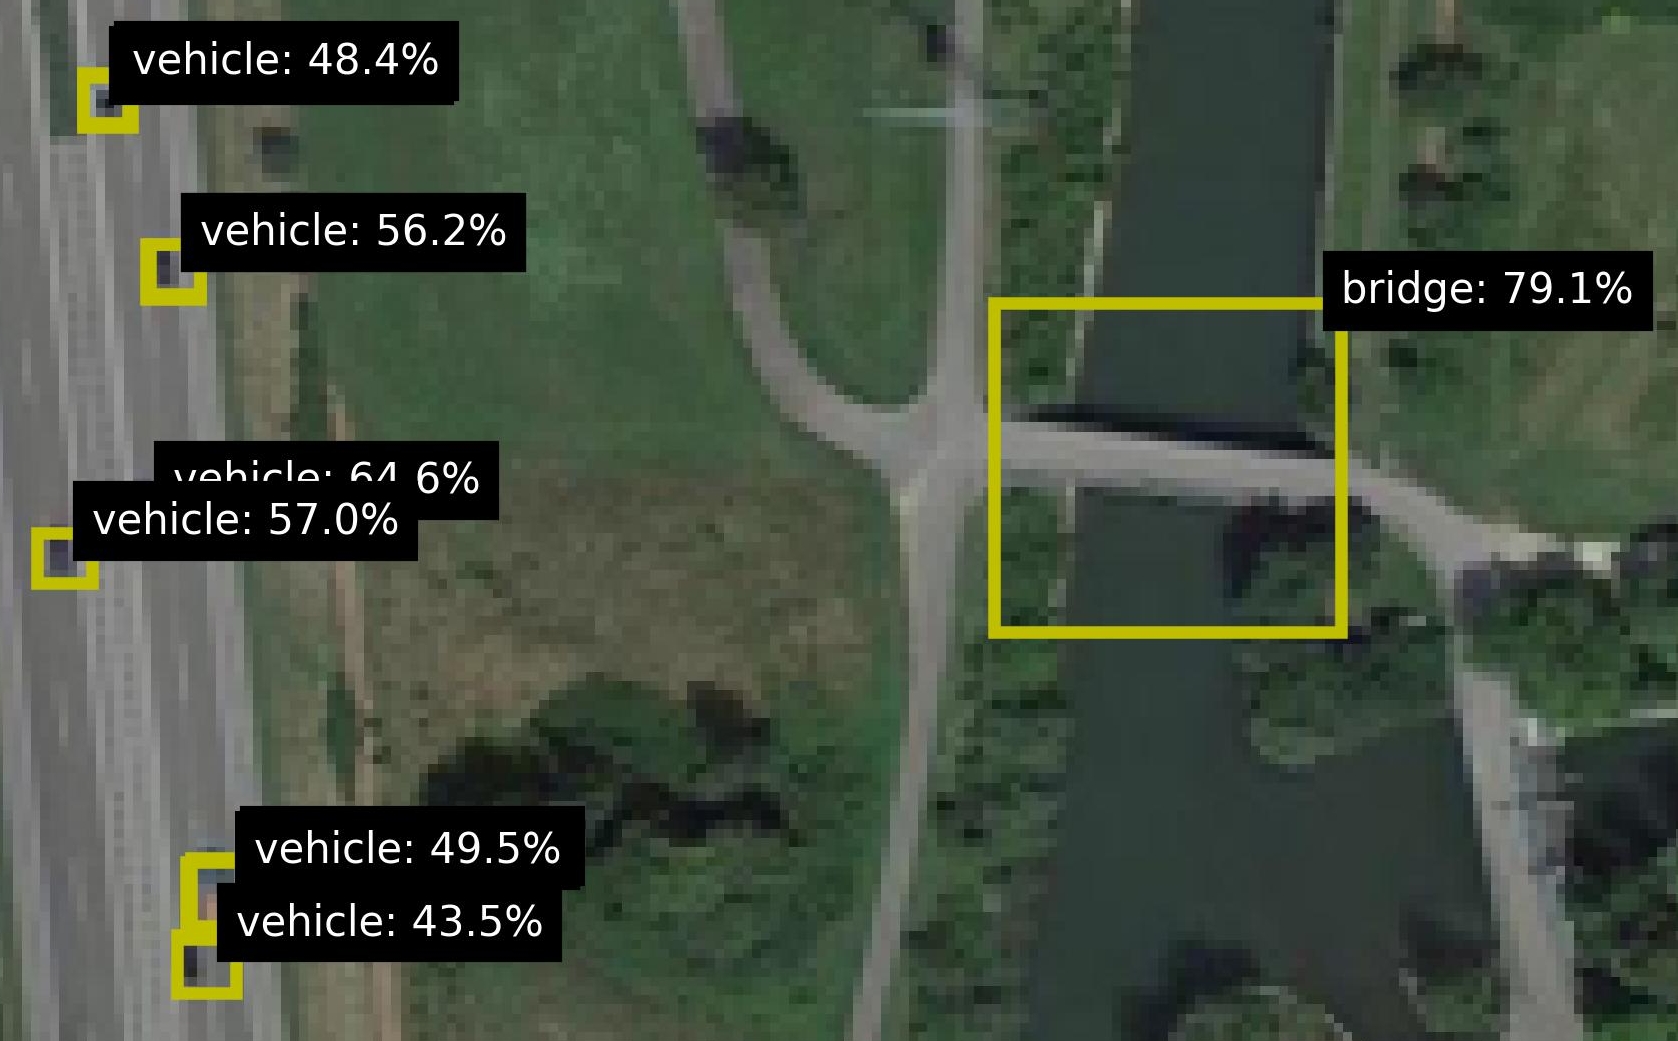
The image is an aerial view of a landscape featuring a river, roads, greenery, and infrastructure. Key elements include a bridge spanning a river, a road network, and multiple vehicles annotated with confidence percentages. The annotations are overlaid as black text boxes with white text, accompanied by yellow bounding boxes highlighting detected objects.
### Components/Axes
- **Annotations**:
- **Bridge**: Labeled "bridge: 79.1%" in the top-right quadrant, positioned above a yellow rectangular bounding box encompassing the bridge structure.
- **Vehicles**: Six annotations labeled "vehicle: [percentage]" (48.4%, 56.2%, 64.6%, 57.0%, 49.5%, 43.5%) clustered along the left side of the image, aligned with yellow bounding boxes indicating vehicle positions on the road.
- **Spatial Layout**:
- **River**: Dark green watercourse running diagonally from top-right to bottom-left.
- **Roads**: Gray pathways intersecting near the bridge, with one road curving leftward and another extending rightward.
- **Greenery**: Light green fields and trees flanking the river and roads.
### Detailed Analysis
- **Bridge**:
- Confidence: 79.1% (highest among all annotations).
- Position: Central-right, spanning the river.
- Bounding Box: Yellow rectangle tightly aligned with the bridge's structure.
- **Vehicles**:
- Confidence scores range from 43.5% (lowest) to 64.6% (highest).
- Positions: Left side of the image, distributed along the road parallel to the river.
- Bounding Boxes: Yellow squares varying in size, correlating with vehicle dimensions and distances from the camera.
- **Unlabeled Elements**:
- River, roads, and greenery lack explicit annotations but are visually distinct.
### Key Observations
1. **Confidence Discrepancies**: Vehicle confidence scores vary significantly (43.5%–64.6%), suggesting differences in detection reliability, possibly due to occlusion, distance, or model uncertainty.
2. **Bridge Prominence**: The bridge's high confidence score (79.1%) indicates it is a dominant feature in the model's analysis, likely due to its size and structural clarity.
3. **Spatial Correlation**: Vehicles are concentrated on the left road, while the bridge dominates the right, reflecting a divided focus in the scene.
### Interpretation
This image appears to be output from an object detection system analyzing infrastructure and traffic. The bridge's high confidence score highlights its importance as a critical infrastructure element, while the varying vehicle percentages may reflect challenges in detecting smaller or partially obscured objects. The absence of annotations for the river and roads suggests the model prioritizes man-made structures over natural features. The spatial distribution of annotations implies the system is tracking traffic flow on the left road and monitoring the bridge's presence, potentially for applications like traffic management or infrastructure monitoring. The lack of a legend or color-coded key limits direct correlation between bounding box colors and confidence levels, but the yellow boxes consistently highlight detected objects.