## Line Chart: First Thoughts vs. Second Thoughts
### Overview
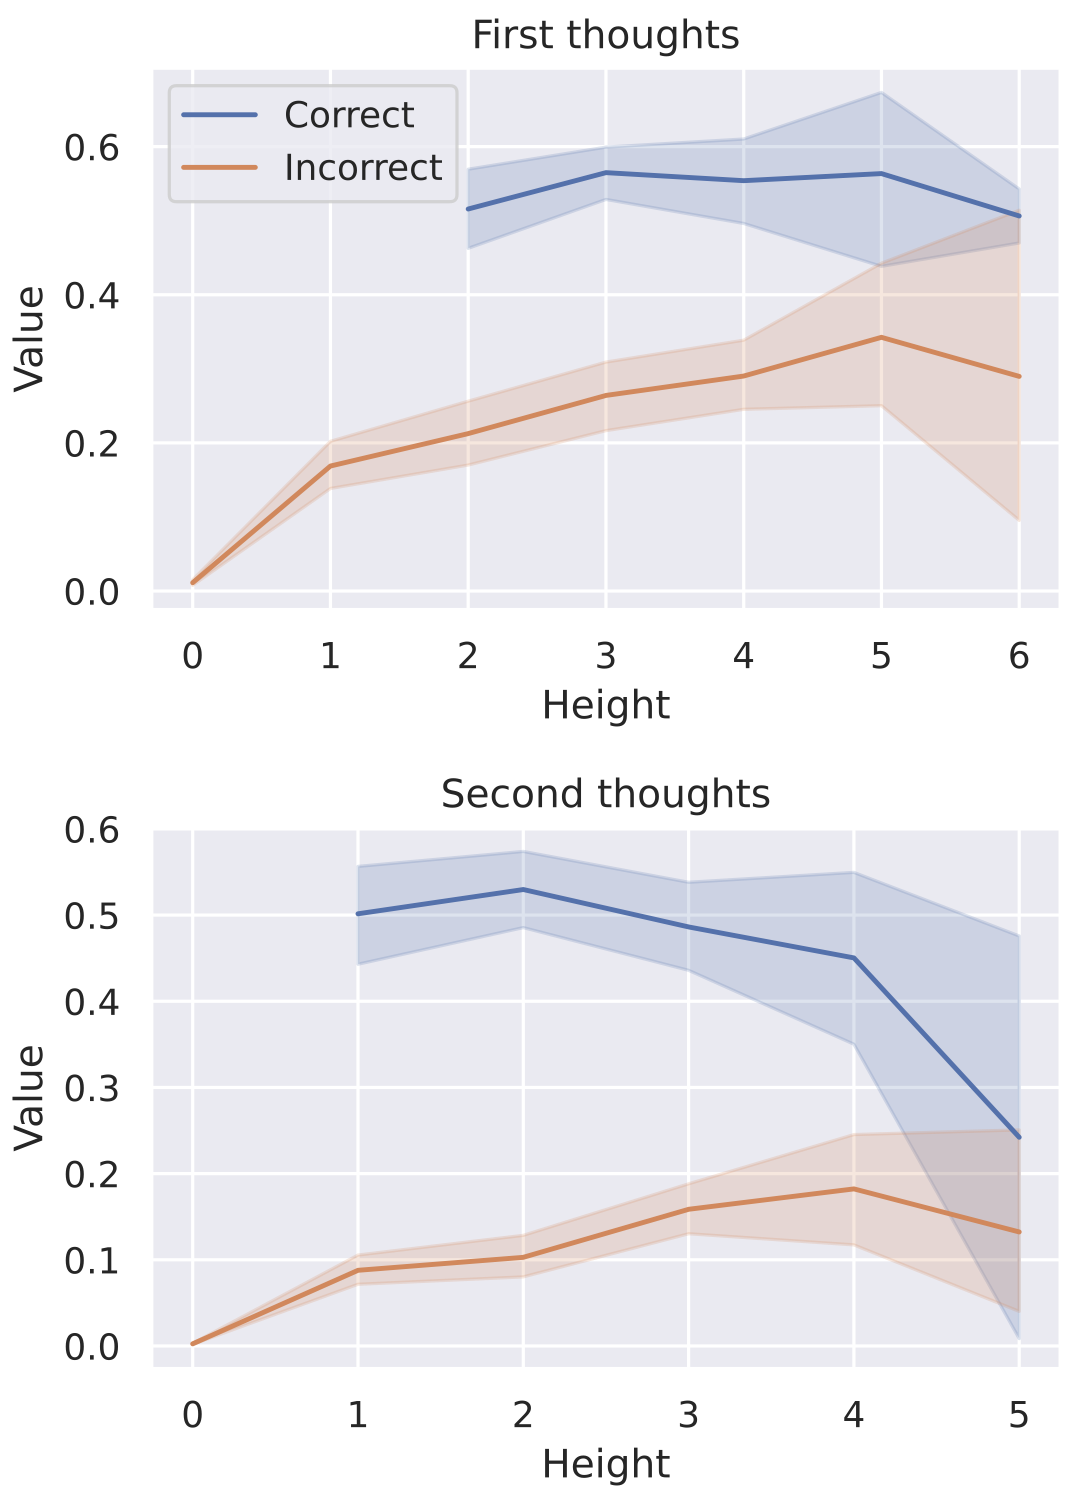
The image contains two line charts, one titled "First thoughts" and the other "Second thoughts." Each chart plots the "Value" (y-axis) against "Height" (x-axis) for two categories: "Correct" and "Incorrect." The charts show how the value changes with height for both correct and incorrect responses, with shaded regions indicating uncertainty or variance.
### Components/Axes
**First Thoughts Chart:**
* **Title:** First thoughts
* **X-axis:** Height, with markers at 0, 1, 2, 3, 4, 5, and 6.
* **Y-axis:** Value, with markers at 0.0, 0.2, 0.4, and 0.6.
* **Legend:** Located in the top-left corner.
* **Correct:** Represented by a blue line.
* **Incorrect:** Represented by an orange line.
**Second Thoughts Chart:**
* **Title:** Second thoughts
* **X-axis:** Height, with markers at 0, 1, 2, 3, 4, and 5.
* **Y-axis:** Value, with markers at 0.0, 0.1, 0.2, 0.3, 0.4, 0.5, and 0.6.
* **Legend:** (Same as above, inferred)
* **Correct:** Represented by a blue line.
* **Incorrect:** Represented by an orange line.
### Detailed Analysis
**First Thoughts Chart:**
* **Correct (Blue Line):** The line starts at approximately 0.52 at Height 2, increases to approximately 0.57 at Height 3, remains relatively stable at approximately 0.57 at Height 4 and 5, and then decreases to approximately 0.52 at Height 6.
* **Incorrect (Orange Line):** The line starts at approximately 0.01 at Height 0, increases to approximately 0.17 at Height 1, increases to approximately 0.25 at Height 2, increases to approximately 0.27 at Height 3, increases to approximately 0.31 at Height 4, increases to approximately 0.34 at Height 5, and then decreases to approximately 0.29 at Height 6.
**Second Thoughts Chart:**
* **Correct (Blue Line):** The line starts at approximately 0.50 at Height 1, increases to approximately 0.53 at Height 2, decreases to approximately 0.50 at Height 3, decreases to approximately 0.45 at Height 4, and then decreases to approximately 0.24 at Height 5.
* **Incorrect (Orange Line):** The line starts at approximately 0.01 at Height 0, increases to approximately 0.09 at Height 1, increases to approximately 0.11 at Height 2, increases to approximately 0.15 at Height 3, increases to approximately 0.17 at Height 4, and then decreases to approximately 0.12 at Height 5.
### Key Observations
* In the "First thoughts" chart, the "Correct" value is consistently higher than the "Incorrect" value across all heights.
* In the "Second thoughts" chart, the "Correct" value starts higher than the "Incorrect" value, but the "Correct" value decreases significantly at higher heights, while the "Incorrect" value remains relatively low.
* The shaded regions around the lines indicate variability or uncertainty in the data.
### Interpretation
The charts compare the "Value" of "Correct" and "Incorrect" responses at different "Heights" for "First thoughts" and "Second thoughts." The "First thoughts" chart suggests that initial responses are more likely to be correct, and this advantage persists across different heights. However, the "Second thoughts" chart reveals a different pattern. While initial "Second thoughts" are also more likely to be correct, the "Correct" value decreases significantly as height increases, suggesting that overthinking or reconsidering can lead to more incorrect responses at higher heights. The "Incorrect" value remains relatively low, indicating that second-guessing doesn't necessarily improve accuracy at higher heights. The shaded regions highlight the variability in the data, suggesting that these trends are not absolute but rather represent general tendencies.