## Chart Type: 2x2 Grid of Line Charts
### Overview
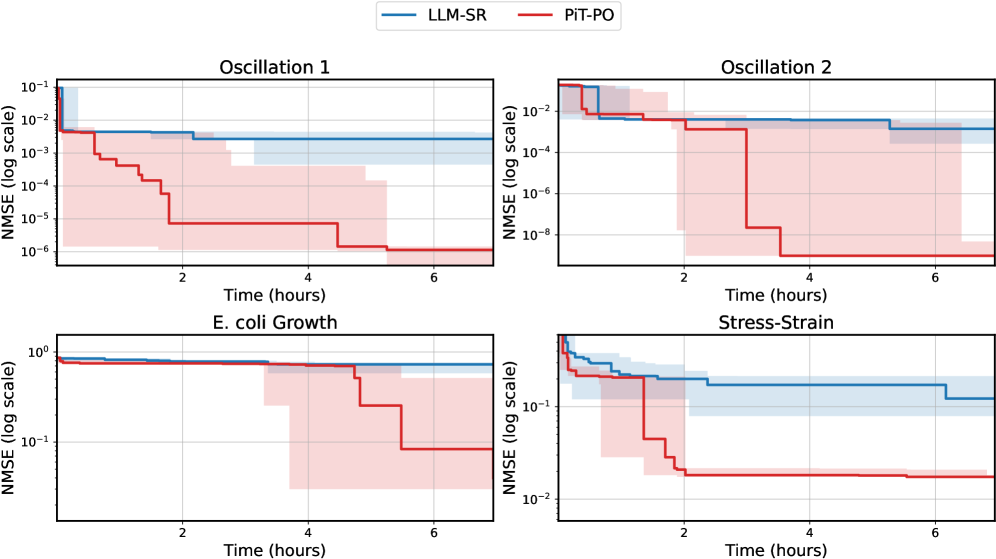
The image displays four line charts arranged in a 2x2 grid, comparing two models (LLM-SR and PIT-PO) across four scenarios: Oscillation 1, Oscillation 2, E. coli Growth, and Stress-Strain. Each chart plots Normalized Mean Squared Error (NMSE) on a logarithmic scale against time (hours). The legend is positioned in the top-right corner, with blue representing LLM-SR and red representing PIT-PO.
### Components/Axes
- **X-axis**: Time (hours), ranging from 0 to 6 hours.
- **Y-axis**: NMSE (log scale), ranging from 10⁻¹ to 10⁻⁸.
- **Legend**:
- Blue: LLM-SR
- Red: PIT-PO
- **Chart Titles**:
- Top-left: Oscillation 1
- Top-right: Oscillation 2
- Bottom-left: E. coli Growth
- Bottom-right: Stress-Strain
### Detailed Analysis
#### Oscillation 1
- **LLM-SR (Blue)**:
- Starts at ~10⁻¹ NMSE at 0h.
- Drops to ~10⁻³ at 2h, ~10⁻⁵ at 4h, and ~10⁻⁶ at 6h.
- Shaded blue region indicates uncertainty, narrowing as NMSE decreases.
- **PIT-PO (Red)**:
- Starts at ~10⁻² NMSE at 0h.
- Drops to ~10⁻⁴ at 2h, ~10⁻⁶ at 4h, and ~10⁻⁸ at 6h.
- Shaded red region shows larger uncertainty than LLM-SR.
#### Oscillation 2
- **LLM-SR (Blue)**:
- Starts at ~10⁻¹ NMSE at 0h.
- Drops to ~10⁻³ at 2h, ~10⁻⁵ at 4h, and ~10⁻⁶ at 6h.
- Shaded region remains consistent in width.
- **PIT-PO (Red)**:
- Starts at ~10⁻² NMSE at 0h.
- Sharp drop to ~10⁻⁴ at 2h, then stabilizes at ~10⁻⁶ by 4h.
- Shaded region narrows significantly after 2h.
#### E. coli Growth
- **LLM-SR (Blue)**:
- Starts at ~10⁰ NMSE at 0h.
- Drops to ~10⁻¹ at 2h, ~10⁻³ at 4h, and ~10⁻⁵ at 6h.
- Shaded region widens slightly after 4h.
- **PIT-PO (Red)**:
- Starts at ~10⁻¹ NMSE at 0h.
- Drops to ~10⁻³ at 2h, ~10⁻⁵ at 4h, and ~10⁻⁷ at 6h.
- Shaded region narrows steadily.
#### Stress-Strain
- **LLM-SR (Blue)**:
- Starts at ~10⁻¹ NMSE at 0h.
- Drops to ~10⁻² at 2h, ~10⁻⁴ at 4h, and ~10⁻⁶ at 6h.
- Shaded region remains narrow.
- **PIT-PO (Red)**:
- Starts at ~10⁻² NMSE at 0h.
- Drops to ~10⁻⁴ at 2h, ~10⁻⁶ at 4h, and ~10⁻⁸ at 6h.
- Shaded region narrows sharply after 2h.
### Key Observations
1. **Model Performance**:
- PIT-PO consistently achieves lower NMSE than LLM-SR across all scenarios.
- Both models show exponential decay in NMSE over time, but PIT-PO’s decline is steeper.
2. **Uncertainty**:
- Shaded regions (likely confidence intervals) are narrower for PIT-PO in most cases, suggesting higher prediction stability.
3. **Scenario-Specific Trends**:
- In Oscillation 2, PIT-PO’s NMSE stabilizes after 2h, while LLM-SR continues to decline.
- E. coli Growth and Stress-Strain show similar decay patterns but differ in baseline NMSE values.
### Interpretation
The data suggests that **PIT-PO outperforms LLM-SR** in all tested scenarios, with faster and more stable convergence to lower error rates. The logarithmic scale emphasizes the exponential improvement in accuracy over time. The shaded regions imply that PIT-PO’s predictions are less variable, which could be critical in applications requiring high reliability (e.g., real-time systems). The consistent trend across diverse scenarios (oscillations, biological growth, mechanical stress) indicates that PIT-PO’s methodology may generalize better than LLM-SR. Further investigation into the architectural or training differences between the models would clarify the source of this performance gap.