\n
## Chart: NMSE vs. Time for Different Oscillations and Conditions
### Overview
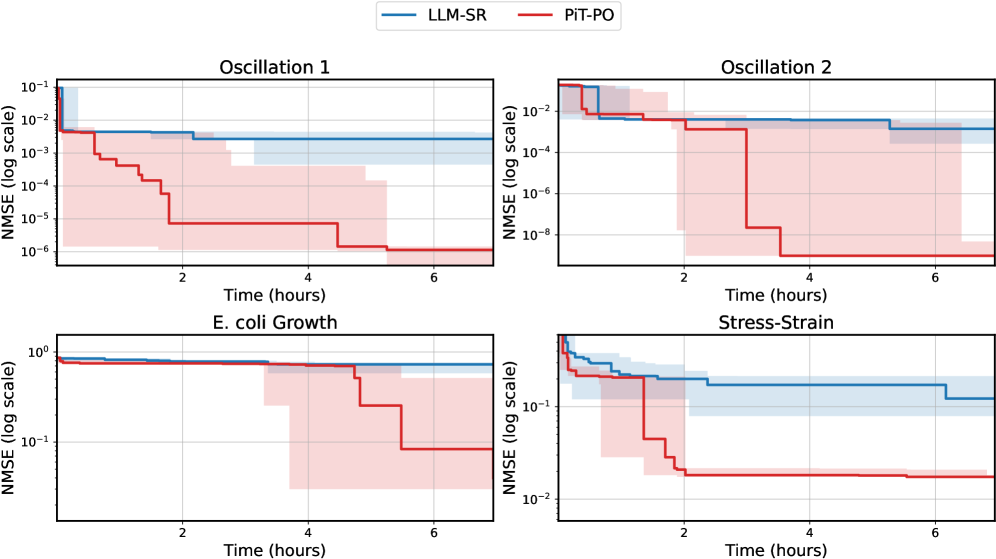
The image presents four line charts, each displaying the Normalized Mean Squared Error (NMSE) on a logarithmic scale against Time (in hours). Each chart represents a different condition: Oscillation 1, Oscillation 2, E. coli Growth, and Stress-Strain. Two methods, LLM-SR (blue) and PIT-PO (red), are compared within each chart. Shaded areas around the lines represent uncertainty or variance.
### Components/Axes
* **X-axis:** Time (hours), ranging from approximately 0 to 7 hours.
* **Y-axis:** NMSE (log scale), ranging from 10<sup>-8</sup> to 10<sup>1</sup>. The scale is logarithmic.
* **Legend:**
* LLM-SR (Blue line)
* PIT-PO (Red line)
* **Chart Titles:**
* Oscillation 1 (Top-left)
* Oscillation 2 (Top-right)
* E. coli Growth (Bottom-left)
* Stress-Strain (Bottom-right)
### Detailed Analysis
**Oscillation 1 (Top-left):**
* The blue line (LLM-SR) starts at approximately 0.01 and decreases to approximately 0.0001 over the 7 hours. The line is relatively smooth.
* The red line (PIT-PO) starts at approximately 0.001 and decreases to approximately 0.00001 over the 7 hours. The line is stepped, with plateaus.
* The shaded area around the blue line is smaller than the shaded area around the red line, indicating less uncertainty for LLM-SR.
**Oscillation 2 (Top-right):**
* The blue line (LLM-SR) starts at approximately 0.02 and decreases to approximately 0.0005 over the 7 hours. The line is relatively smooth.
* The red line (PIT-PO) starts at approximately 0.01 and decreases to approximately 0.0001 over the 7 hours. The line is stepped, with plateaus.
* The shaded area around the blue line is smaller than the shaded area around the red line, indicating less uncertainty for LLM-SR.
**E. coli Growth (Bottom-left):**
* The blue line (LLM-SR) starts at approximately 0.1 and decreases to approximately 0.01 over the 7 hours. The line is relatively smooth.
* The red line (PIT-PO) starts at approximately 0.05 and decreases to approximately 0.005 over the 7 hours. The line is stepped, with plateaus.
* The shaded area around the blue line is smaller than the shaded area around the red line, indicating less uncertainty for LLM-SR.
**Stress-Strain (Bottom-right):**
* The blue line (LLM-SR) starts at approximately 0.2 and decreases to approximately 0.02 over the 7 hours. The line is relatively smooth.
* The red line (PIT-PO) starts at approximately 0.1 and decreases to approximately 0.005 over the 7 hours. The line is stepped, with plateaus.
* The shaded area around the blue line is smaller than the shaded area around the red line, indicating less uncertainty for LLM-SR.
### Key Observations
* In all four conditions, the LLM-SR method (blue line) generally exhibits lower NMSE values than the PIT-PO method (red line) at most time points.
* The PIT-PO method (red line) consistently shows a stepped pattern, suggesting discrete updates or adjustments in its error calculation.
* The uncertainty (shaded areas) around the LLM-SR lines is consistently smaller than that around the PIT-PO lines, indicating more stable and reliable performance.
* The NMSE decreases over time for both methods in all conditions, indicating improved performance or convergence.
### Interpretation
The charts demonstrate that the LLM-SR method consistently outperforms the PIT-PO method across all tested conditions (Oscillation 1, Oscillation 2, E. coli Growth, and Stress-Strain) in terms of NMSE. The lower NMSE values and smaller uncertainty intervals suggest that LLM-SR provides more accurate and reliable predictions or estimations compared to PIT-PO. The stepped nature of the PIT-PO results suggests that its calculations are performed in discrete steps, potentially leading to less smooth and potentially less accurate results. The decreasing NMSE over time for both methods indicates that both methods are learning or adapting to the data, but LLM-SR does so more effectively. The logarithmic scale emphasizes the magnitude of the error reduction, particularly at lower NMSE values. The consistent performance advantage of LLM-SR across diverse conditions suggests its robustness and generalizability.