## Line Chart: Model Accuracy vs Number of Operands (digits=3) for Different Recurrence Levels
### Overview
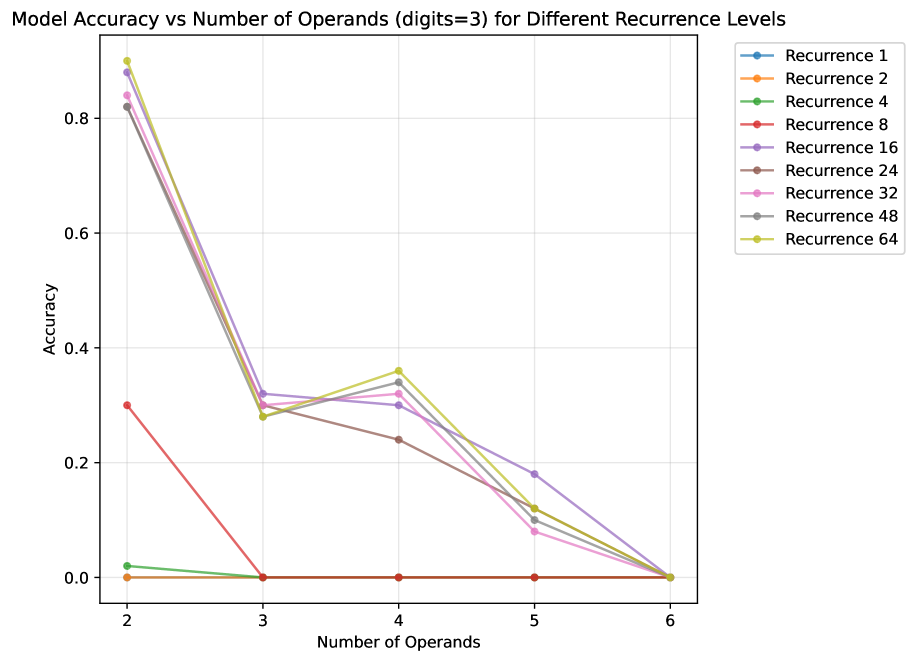
This is a line chart illustrating the relationship between a model's accuracy and the number of operands in a task (with digits fixed at 3), across nine different "Recurrence Level" configurations. The chart shows a general trend where accuracy decreases as the number of operands increases, with higher recurrence levels starting at much higher accuracy for simpler tasks but also degrading significantly.
### Components/Axes
* **Chart Title:** "Model Accuracy vs Number of Operands (digits=3) for Different Recurrence Levels"
* **X-Axis:** Labeled "Number of Operands". It has discrete markers at the integer values: 2, 3, 4, 5, and 6.
* **Y-Axis:** Labeled "Accuracy". It is a linear scale ranging from 0.0 to approximately 0.9, with major gridlines at intervals of 0.2 (0.0, 0.2, 0.4, 0.6, 0.8).
* **Legend:** Positioned in the top-right corner, outside the main plot area. It lists nine data series, each corresponding to a "Recurrence" level, identified by a unique color and marker (a filled circle).
* Recurrence 1 (Blue)
* Recurrence 2 (Orange)
* Recurrence 4 (Green)
* Recurrence 8 (Red)
* Recurrence 16 (Purple)
* Recurrence 24 (Brown)
* Recurrence 32 (Pink)
* Recurrence 48 (Gray)
* Recurrence 64 (Yellow-Green)
### Detailed Analysis
**Data Series Trends and Approximate Values:**
* **Low Recurrence Levels (1, 2, 4, 8):** These series show very low accuracy overall.
* **Recurrence 1 (Blue):** Starts at ~0.0 accuracy for 2 operands and remains at 0.0 for all subsequent operand counts (3, 4, 5, 6).
* **Recurrence 2 (Orange):** Follows an identical flat trend at 0.0 accuracy across all operand counts.
* **Recurrence 4 (Green):** Starts slightly above 0.0 (~0.02) at 2 operands, drops to 0.0 at 3 operands, and remains at 0.0 thereafter.
* **Recurrence 8 (Red):** Starts at a moderate accuracy of ~0.30 for 2 operands. It then drops sharply to 0.0 at 3 operands and remains at 0.0 for 4, 5, and 6 operands.
* **High Recurrence Levels (16, 24, 32, 48, 64):** These series follow a similar pattern: high initial accuracy, a steep drop, a partial recovery, then a final decline.
* **Common Pattern:** All start with high accuracy at 2 operands (ranging from ~0.82 to ~0.90). They experience a dramatic drop at 3 operands (to a range of ~0.28 to ~0.32). At 4 operands, most show a slight recovery or plateau. Accuracy then declines again at 5 operands, and all converge to 0.0 accuracy at 6 operands.
* **Recurrence 64 (Yellow-Green):** The highest performer initially. Starts at ~0.90 (2 operands), drops to ~0.28 (3), recovers to the series' peak at ~0.36 (4), falls to ~0.12 (5), and ends at 0.0 (6).
* **Recurrence 48 (Gray):** Starts at ~0.88 (2), drops to ~0.31 (3), rises to ~0.34 (4), falls to ~0.11 (5), ends at 0.0 (6).
* **Recurrence 32 (Pink):** Starts at ~0.85 (2), drops to ~0.30 (3), rises slightly to ~0.32 (4), falls to ~0.08 (5), ends at 0.0 (6).
* **Recurrence 24 (Brown):** Starts at ~0.82 (2), drops to ~0.31 (3), then declines steadily to ~0.24 (4), ~0.12 (5), and 0.0 (6). It does not show the recovery at 4 operands seen in others.
* **Recurrence 16 (Purple):** Starts at ~0.83 (2), drops to ~0.32 (3), holds near ~0.30 (4), then declines to ~0.18 (5) and 0.0 (6). It maintains the highest accuracy among all series at 5 operands.
### Key Observations
1. **Performance Threshold:** There is a clear performance cliff. Models with recurrence levels of 8 or below fail almost completely (accuracy at or near 0.0) for tasks with 3 or more operands.
2. **The "3-Operand Dip":** All high-recurrence models experience their most severe relative performance drop when moving from 2 to 3 operands.
3. **The "4-Operand Bump":** Most high-recurrence models (except Recurrence 24) show a slight accuracy improvement or stabilization when moving from 3 to 4 operands, suggesting a possible non-linear difficulty curve in the task.
4. **Universal Failure Point:** All models, regardless of recurrence level, achieve 0.0 accuracy when tasked with 6 operands, indicating a fundamental limit of the model architecture or training for this specific problem complexity.
5. **Recurrence Correlation:** Higher recurrence levels generally correlate with higher accuracy, but only up to a point. The benefit is most pronounced for simpler tasks (2 operands). For complex tasks (5-6 operands), the advantage of higher recurrence diminishes significantly.
### Interpretation
This chart demonstrates the critical role of recurrence (likely referring to the number of processing steps or layers in a recurrent neural network or similar architecture) in solving compositional tasks. The data suggests:
* **Recurrence Enables Compositionality:** Higher recurrence allows the model to handle the basic composition of two operands effectively. The near-zero performance of low-recurrence models indicates they lack the capacity to perform even this basic step.
* **Complexity Scaling is Non-Linear:** The sharp drop at 3 operands and the bump at 4 suggest the task difficulty does not increase linearly with operand count. There may be a specific cognitive or computational hurdle at 3 operands that some models can partially overcome with more steps (the bump at 4), but which becomes insurmountable at 5 or 6 operands.
* **Architectural Limits:** The universal failure at 6 operands points to a hard limit. This could be due to vanishing/exploding gradients in a recurrent system, a fixed context window being exceeded, or the training data not containing sufficient examples of this complexity. The model's "working memory" or "reasoning depth" appears capped at handling around 4-5 operands for this specific 3-digit task.
* **Practical Implication:** For applications requiring arithmetic or logical operations on more than 4-5 items, this model architecture, even with high recurrence, is unreliable. A different approach (e.g., a transformer with larger context, or a neuro-symbolic system) may be necessary.