\n
## Scatter Plot with Error Bars: Concept Development Over Trials
### Overview
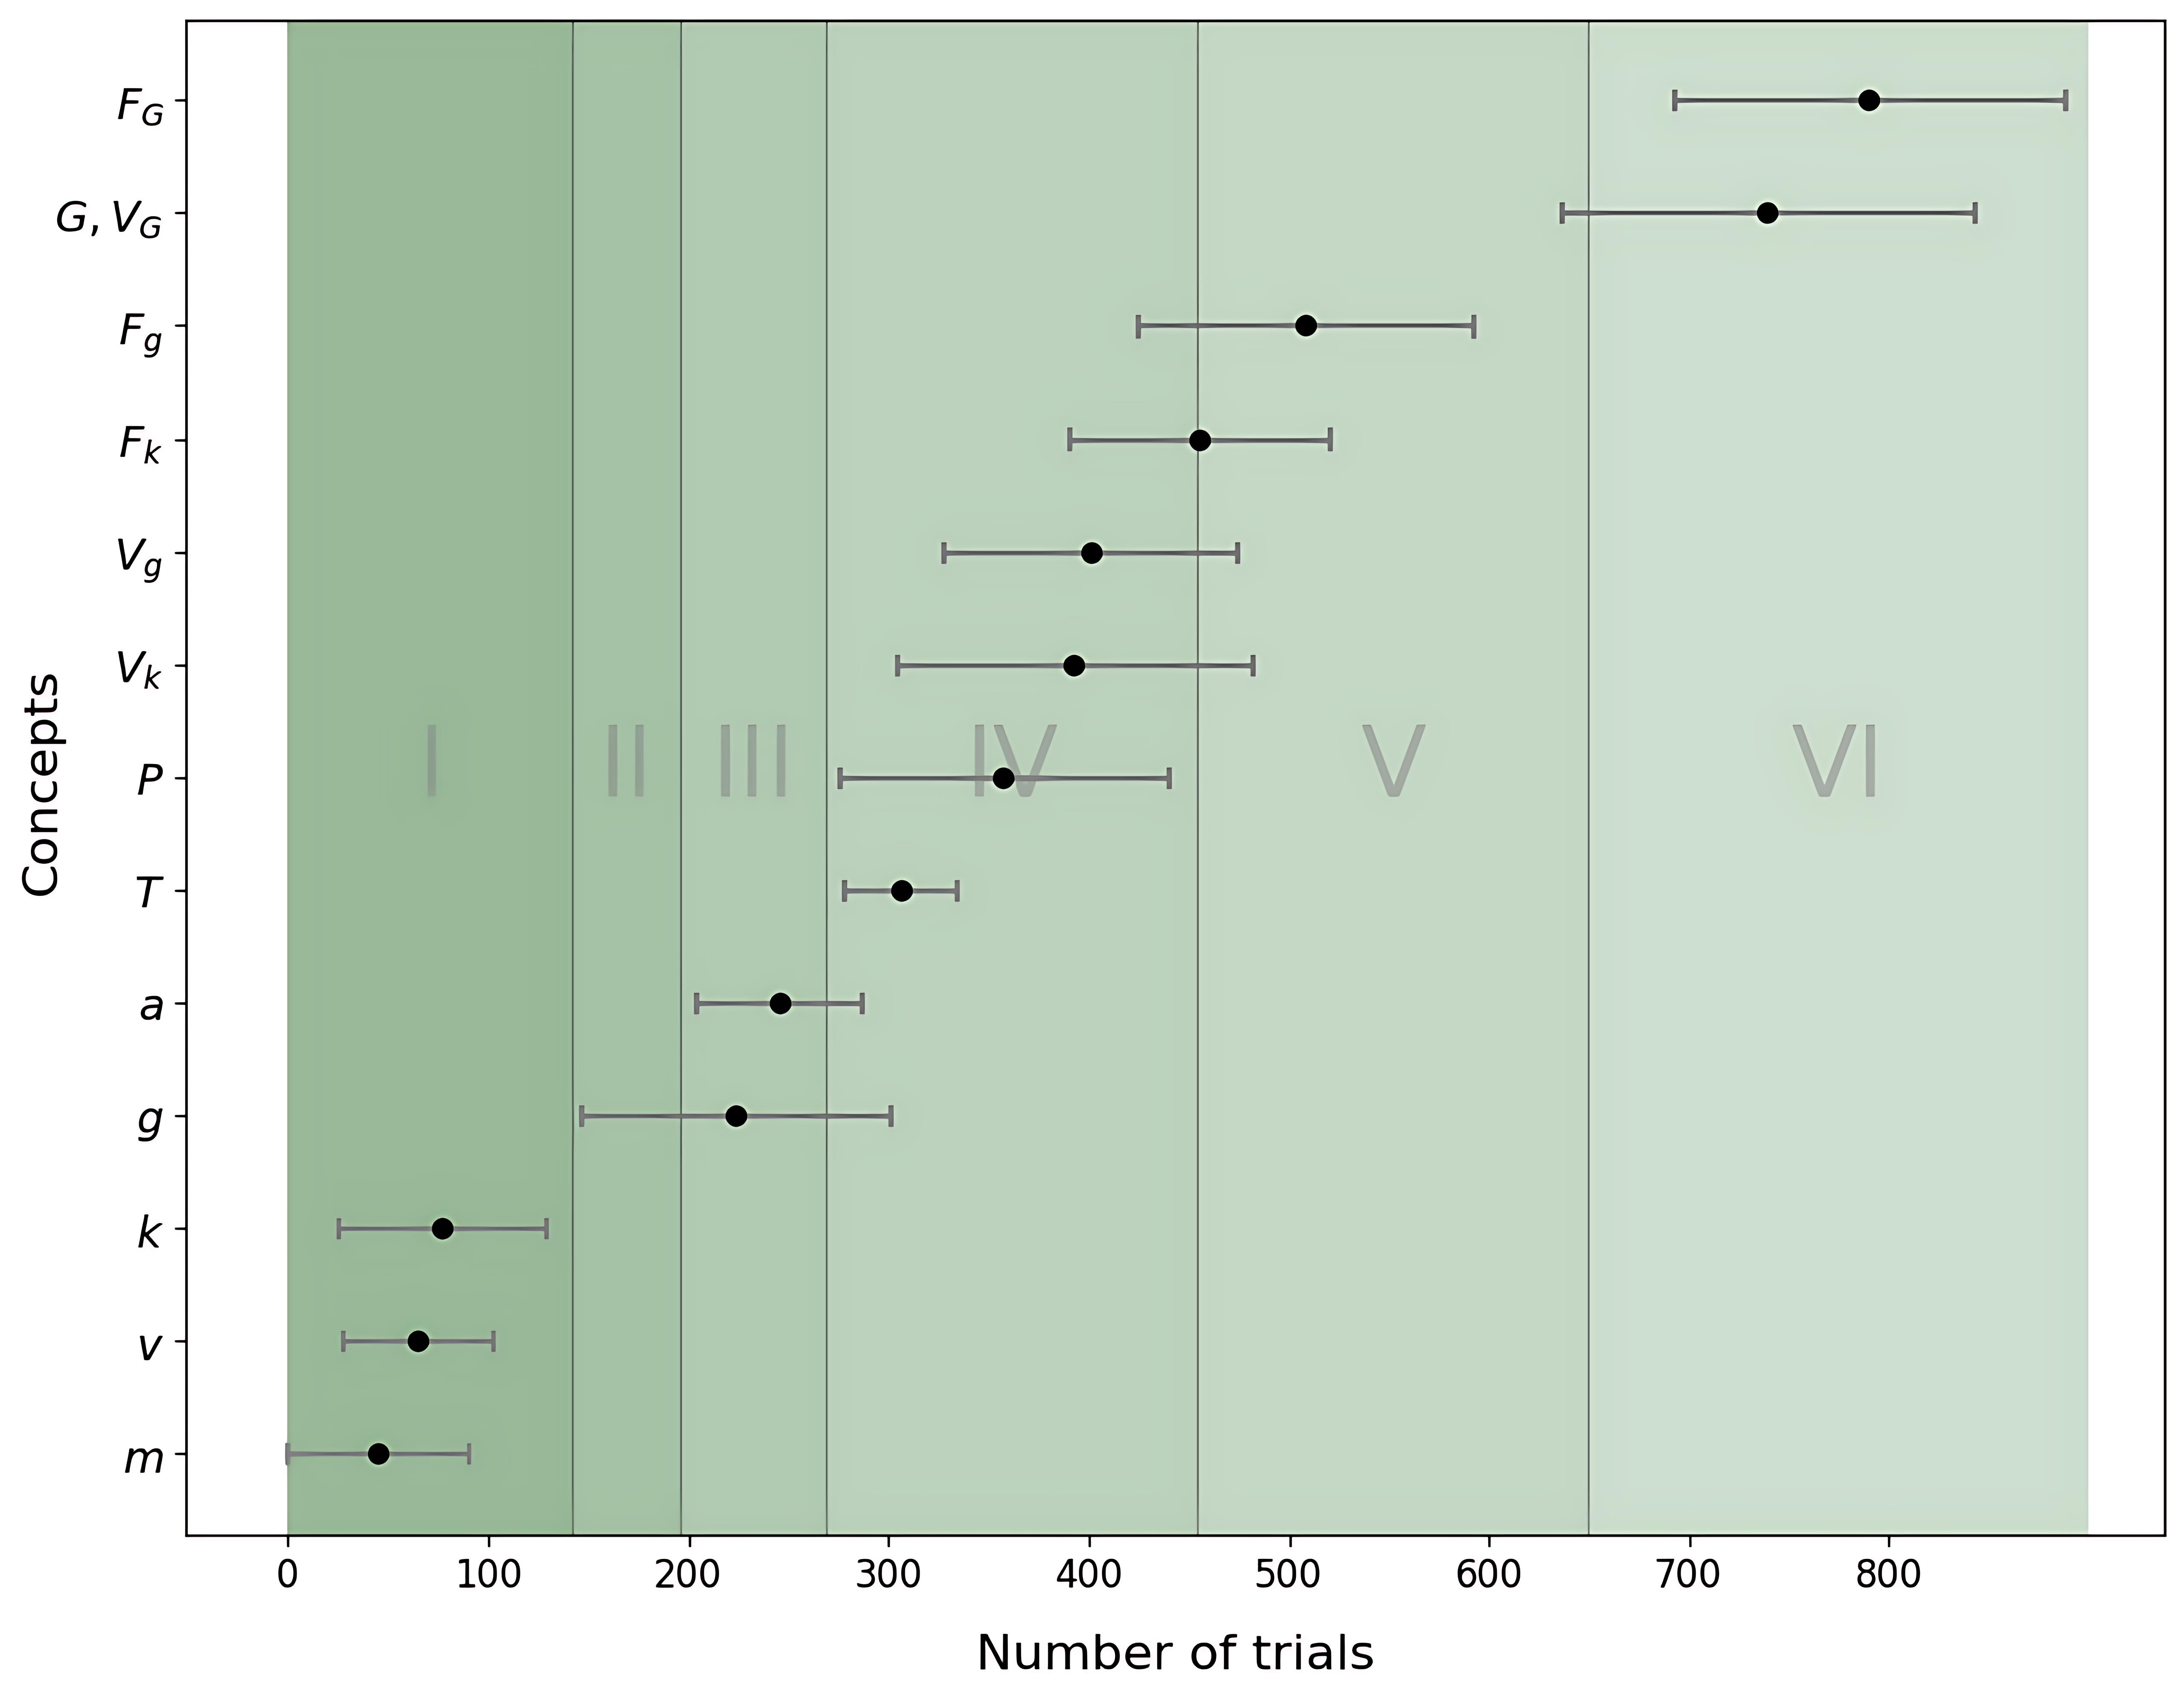
The image presents a scatter plot with error bars, illustrating the development of several concepts (labeled F<sub>G</sub>, G, V<sub>G</sub>, F<sub>k</sub>, V<sub>k</sub>, P, T, a, g, k, l, m) across a range of trials. The x-axis represents the number of trials, while the y-axis lists the concepts. The plot is divided into six vertical regions labeled I through VI, likely representing stages or phases of development. Each concept is represented by a data point with horizontal error bars indicating uncertainty.
### Components/Axes
* **X-axis:** Number of trials (Scale: 0 to 800, increments of 100)
* **Y-axis:** Concepts (Labels: F<sub>G</sub>, G, V<sub>G</sub>, F<sub>k</sub>, V<sub>k</sub>, P, T, a, g, k, l, m) - listed from top to bottom.
* **Vertical Regions:** Labeled I, II, III, IV, V, VI, dividing the plot into stages.
* **Data Points:** Black dots representing the concept's value at a given number of trials.
* **Error Bars:** Horizontal lines extending from each data point, indicating the uncertainty or range of values.
### Detailed Analysis
The data points and their approximate values (with uncertainty represented by the error bar extent) are as follows:
* **F<sub>G</sub>:** Appears around 700 trials, at approximately y = 7.5, with an error bar extending roughly ± 0.5.
* **G, V<sub>G</sub>:** Both appear around 700 trials, G at approximately y = 6.5, with an error bar extending roughly ± 0.5, and V<sub>G</sub> at approximately y = 6, with an error bar extending roughly ± 0.5.
* **F<sub>k</sub>:** Appears around 400 trials, at approximately y = 5, with an error bar extending roughly ± 0.5.
* **V<sub>g</sub>:** Appears around 300 trials, at approximately y = 4.5, with an error bar extending roughly ± 0.5.
* **V<sub>k</sub>:** Appears around 300 trials, at approximately y = 4, with an error bar extending roughly ± 0.5.
* **P:** Appears around 300 trials, at approximately y = 3.5, with an error bar extending roughly ± 0.5.
* **T:** Appears around 300 trials, at approximately y = 3, with an error bar extending roughly ± 0.5.
* **a:** Appears around 200 trials, at approximately y = 2.5, with an error bar extending roughly ± 0.5.
* **g:** Appears around 200 trials, at approximately y = 2, with an error bar extending roughly ± 0.5.
* **k:** Appears around 100 trials, at approximately y = 1.5, with an error bar extending roughly ± 0.5.
* **l:** Appears around 100 trials, at approximately y = 1.2, with an error bar extending roughly ± 0.3.
* **m:** Appears around 0 trials, at approximately y = 0.8, with an error bar extending roughly ± 0.3.
**Trends:**
* Concepts generally appear later in the trial sequence.
* The concepts appear to emerge sequentially, with 'm' appearing first and 'F<sub>G</sub>' appearing last.
* The error bars suggest a relatively consistent level of uncertainty across all concepts and trials.
### Key Observations
* The concepts are ordered on the y-axis, potentially indicating a hierarchy or dependency.
* The division into stages (I-VI) suggests a structured process of concept development.
* The error bars are relatively consistent in size, suggesting similar levels of uncertainty in the measurement or estimation of each concept's value.
* There is a clear progression of concept emergence as the number of trials increases.
### Interpretation
The data suggests a staged process of concept development, where simpler concepts ('m', 'l', 'k') emerge earlier in the trial sequence, and more complex concepts ('F<sub>G</sub>', 'G', 'V<sub>G</sub>') emerge later. The vertical regions (I-VI) likely represent distinct phases of this development, potentially involving different learning mechanisms or cognitive processes. The error bars indicate that the concept values are not precisely defined, but rather represent a range of possible values, reflecting the inherent uncertainty in the measurement or estimation of these concepts.
The sequential emergence of concepts suggests a building-block approach to learning, where earlier concepts serve as foundations for later, more complex concepts. The consistent error bar size suggests that the uncertainty associated with each concept is relatively stable throughout the trial sequence. This could indicate that the learning process is consistent and predictable, or that the measurement methods are reliable.
The plot provides a visual representation of how cognitive structures or understanding evolve over time through repeated trials or experiences. It could be used to model learning processes, track the development of expertise, or evaluate the effectiveness of training programs.