\n
## Histogram: Proportion vs. Model Confidence
### Overview
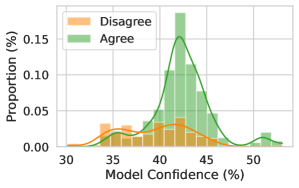
The image presents a histogram displaying the proportion of responses categorized as "Agree" and "Disagree" against varying levels of "Model Confidence". The data is visualized using stacked bars and overlaid density curves.
### Components/Axes
* **X-axis:** "Model Confidence (%)", ranging from approximately 30% to 50%. Marked at 30, 35, 40, 45, and 50.
* **Y-axis:** "Proportion (%)", ranging from 0.00 to 0.15. Marked at 0.00, 0.05, 0.10, and 0.15.
* **Legend:** Located in the top-left corner.
* Orange: "Disagree"
* Green: "Agree"
* **Data Representation:** Stacked bars representing the proportion of "Disagree" and "Agree" responses for each confidence level. Overlaid are smooth density curves for each category.
### Detailed Analysis
The "Agree" data (green) exhibits a unimodal distribution, peaking at approximately 43-45% Model Confidence, with a proportion of around 0.12-0.13. The distribution is roughly symmetrical around the peak.
The "Disagree" data (orange) shows a less pronounced peak around 33-35% Model Confidence, with a proportion of approximately 0.03-0.04. It also has a smaller peak around 42-43% Model Confidence with a proportion of approximately 0.02-0.03. The distribution is more spread out and less symmetrical than the "Agree" data.
Here's a breakdown of approximate values based on visual estimation:
| Model Confidence (%) | Proportion (Disagree - Orange) | Proportion (Agree - Green) |
|---|---|---|
| 30 | ~0.01 | ~0.01 |
| 35 | ~0.03 | ~0.03 |
| 40 | ~0.02 | ~0.07 |
| 42 | ~0.03 | ~0.10 |
| 43 | ~0.02 | ~0.12 |
| 44 | ~0.01 | ~0.13 |
| 45 | ~0.01 | ~0.11 |
| 50 | ~0.01 | ~0.03 |
### Key Observations
* The "Agree" responses are significantly more frequent than "Disagree" responses across most confidence levels.
* The highest proportion of "Agree" responses occurs when the Model Confidence is around 43-45%.
* The "Disagree" responses show a slight increase in proportion around 35% Model Confidence.
* The density curves provide a smoothed representation of the underlying distributions, highlighting the central tendency and spread of each category.
### Interpretation
The data suggests a strong positive correlation between Model Confidence and the proportion of "Agree" responses. As the model becomes more confident in its predictions (increasing Model Confidence), the likelihood of receiving an "Agree" response increases substantially. The peak at 43-45% suggests that this level of confidence is particularly persuasive or aligns well with human judgment. The smaller peak in "Disagree" around 35% could indicate a region where the model's confidence is high enough to elicit a response, but not high enough to guarantee agreement. The overall shape of the distributions implies that the model's performance is generally better at higher confidence levels, and that disagreement is more common when the model is less certain. The data could be used to calibrate the model's confidence scores or to identify areas where the model needs improvement.