## Charts: Law School Admissions - Distribution Analysis
### Overview
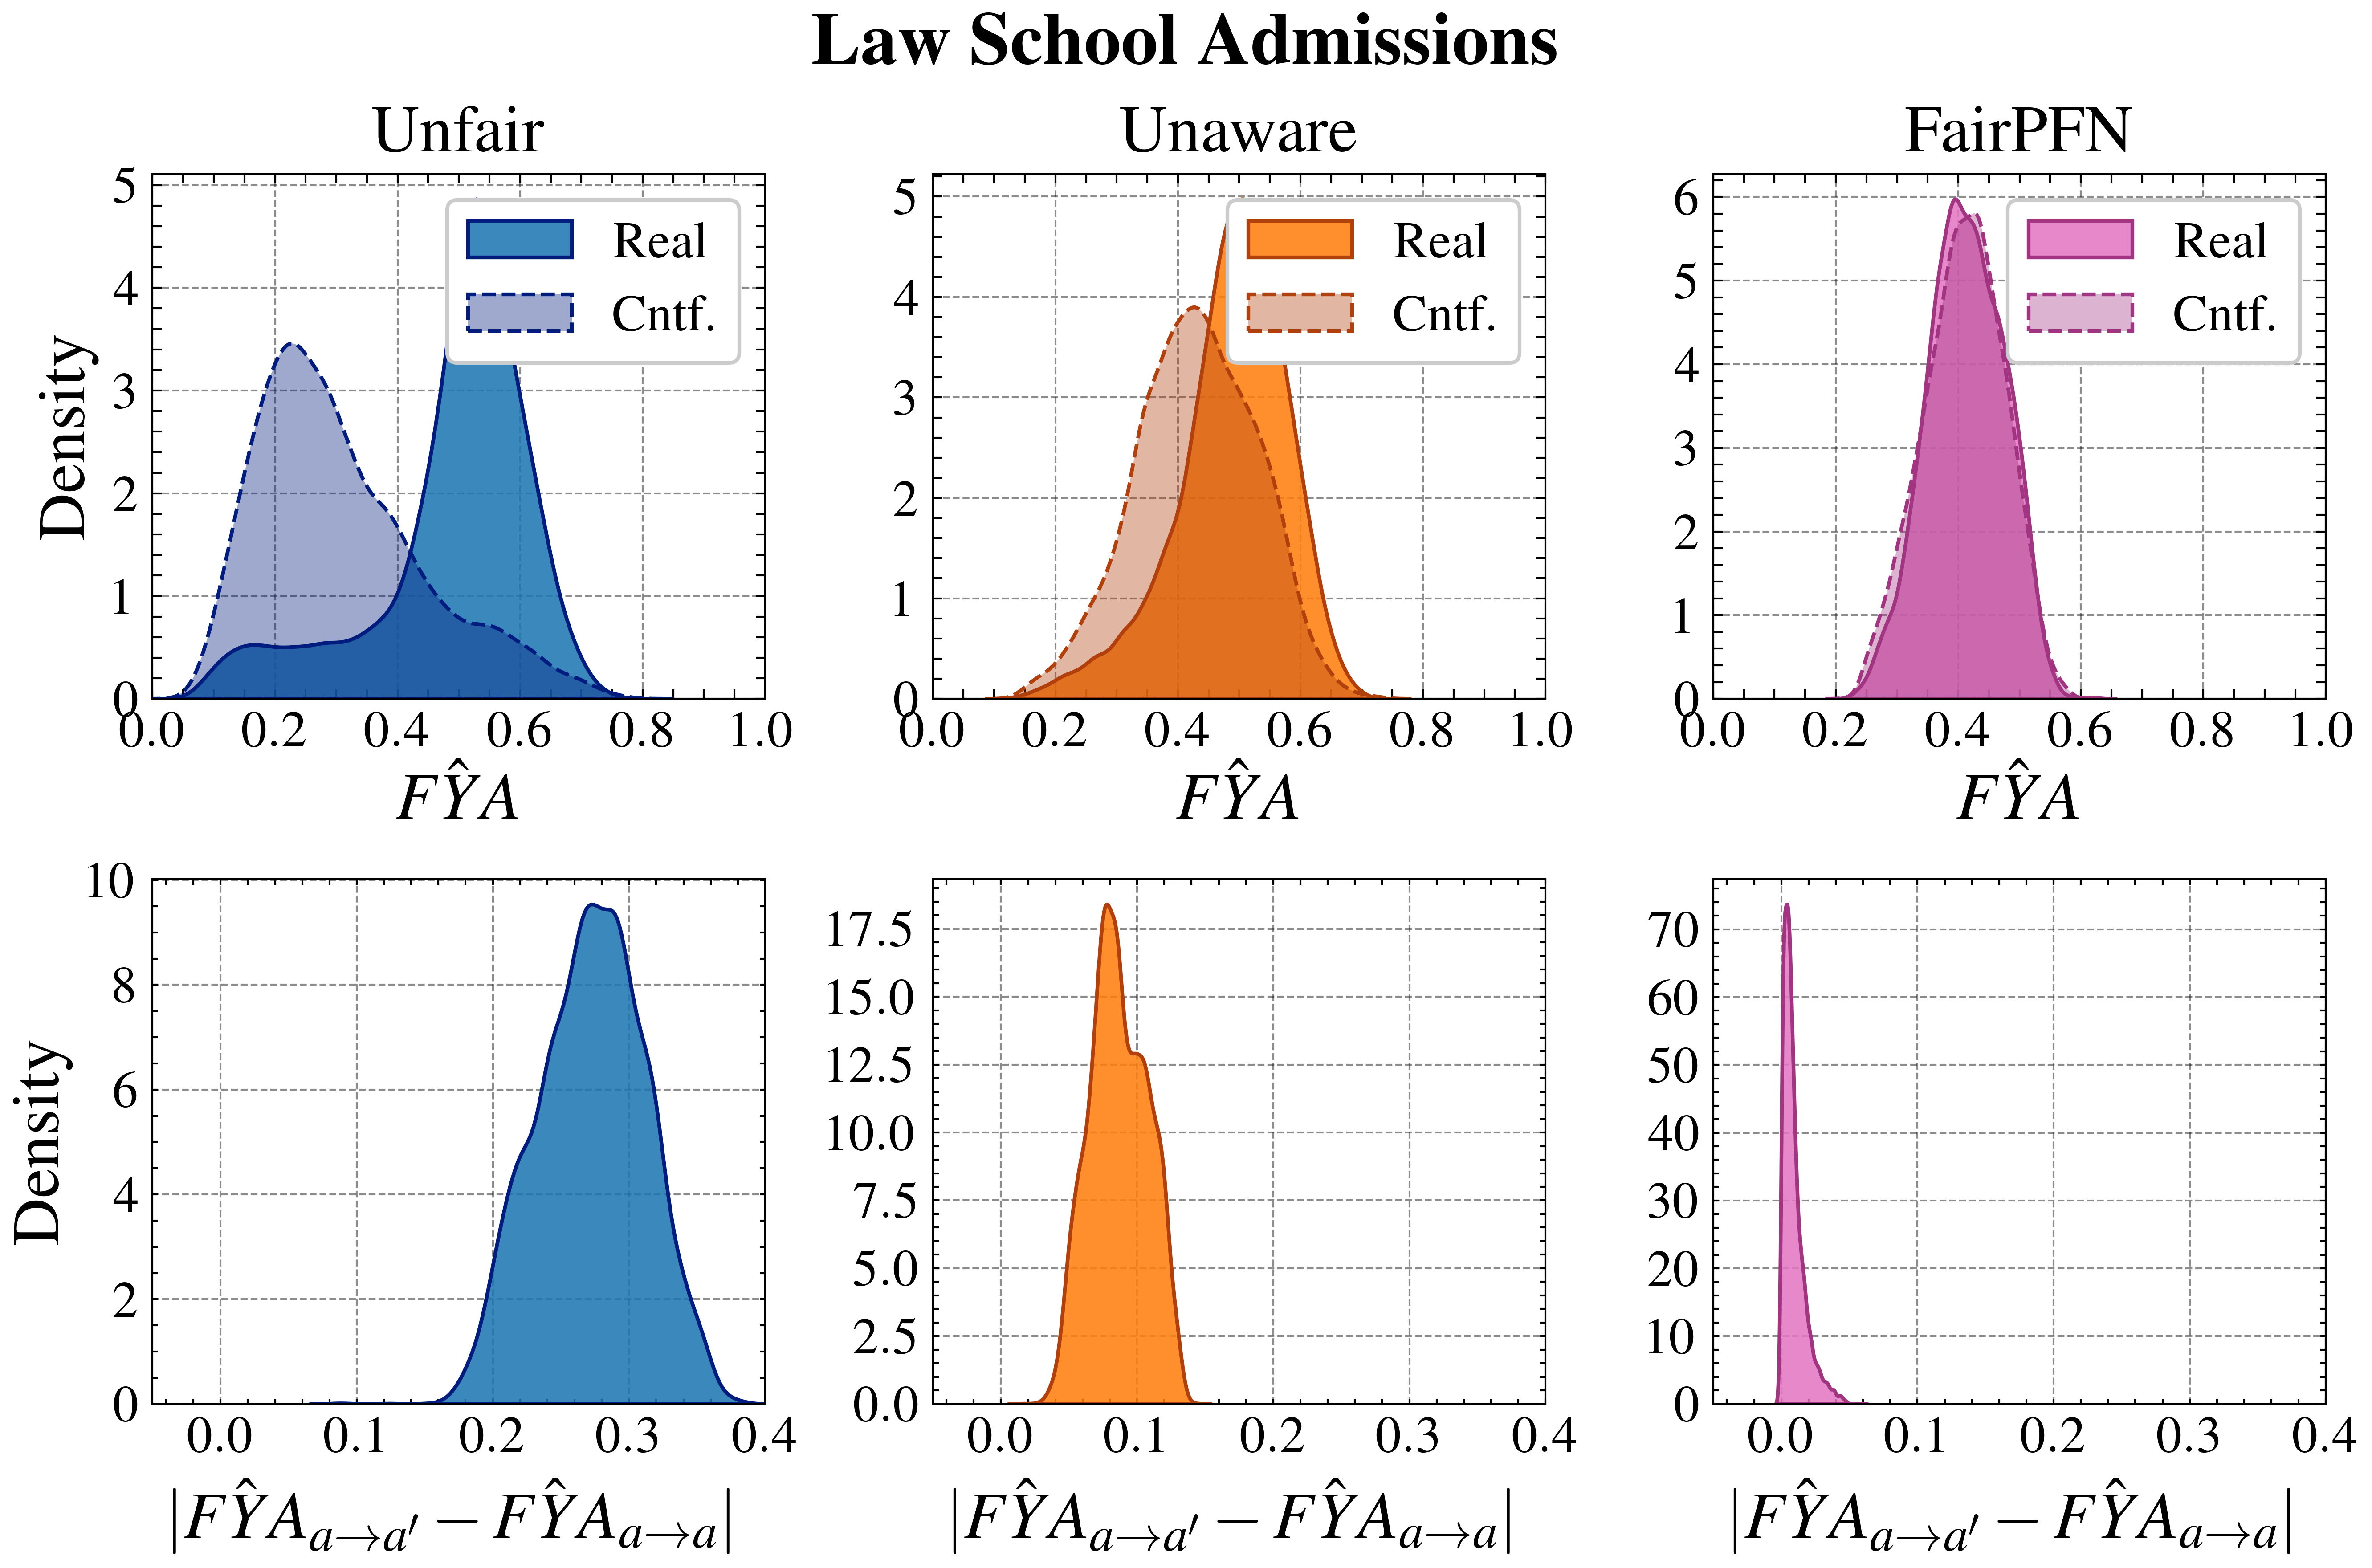
The image presents six density plots comparing "Real" and "Cntf." (likely representing "Counterfactual") distributions for three different scenarios: "Unfair", "Unaware", and "FairPFN". The x-axis in the top row represents "FŶA" (likely a predicted fairness metric), and the x-axis in the bottom row represents the absolute difference between two fairness predictions. The y-axis in all plots represents "Density".
### Components/Axes
* **Title:** Law School Admissions
* **Subtitles:** Unfair, Unaware, FairPFN (arranged horizontally across the top row)
* **X-axis (Top Row):** FŶA, ranging from 0.0 to 1.0, with increments of 0.1.
* **X-axis (Bottom Row):** |FŶA<sub>α→α'</sub> - FŶA<sub>α→α</sub>|, ranging from 0.0 to 0.4, with increments of 0.1.
* **Y-axis (All Plots):** Density, ranging from 0.0 to approximately 5.0 (top row) and 8.0 (bottom row).
* **Legend:**
* Blue: Real
* Hatched Blue: Cntf. (in "Unfair" plot)
* Orange: Real
* Hatched Orange: Cntf. (in "Unaware" plot)
* Magenta: Real
* Hatched Magenta: Cntf. (in "FairPFN" plot)
### Detailed Analysis
**Unfair (Top-Left)**
* **Real (Blue):** The distribution is bimodal, with peaks around 0.25 and 0.65. Density reaches a maximum of approximately 4.2 at 0.25 and 3.8 at 0.65.
* **Cntf. (Hatched Blue):** The distribution is similar to "Real" but slightly smoother, with peaks around 0.28 and 0.62. Density reaches a maximum of approximately 3.5 at 0.28 and 3.2 at 0.62.
* **Trend:** Both distributions exhibit a similar bimodal pattern.
**Unaware (Top-Center)**
* **Real (Orange):** The distribution is unimodal, peaking around 0.5. Density reaches a maximum of approximately 4.8 at 0.5.
* **Cntf. (Hatched Orange):** The distribution is also unimodal, peaking around 0.5, but is more spread out than "Real". Density reaches a maximum of approximately 3.8 at 0.5.
* **Trend:** Both distributions are unimodal, centered around 0.5.
**FairPFN (Top-Right)**
* **Real (Magenta):** The distribution is unimodal, peaking around 0.8. Density reaches a maximum of approximately 5.0 at 0.8.
* **Cntf. (Hatched Magenta):** The distribution is also unimodal, peaking around 0.8, but is more spread out than "Real". Density reaches a maximum of approximately 4.0 at 0.8.
* **Trend:** Both distributions are unimodal, centered around 0.8.
**Unfair (Bottom-Left)**
* **Real (Blue):** The distribution is unimodal, peaking around 0.1. Density reaches a maximum of approximately 7.5 at 0.1.
* **Trend:** The distribution is heavily skewed towards lower values.
**Unaware (Bottom-Center)**
* **Real (Orange):** The distribution is unimodal, peaking around 0.15. Density reaches a maximum of approximately 16.5 at 0.15.
* **Trend:** The distribution is heavily skewed towards lower values.
**FairPFN (Bottom-Right)**
* **Real (Magenta):** The distribution is unimodal, peaking around 0.05. Density reaches a maximum of approximately 65 at 0.05.
* **Trend:** The distribution is heavily skewed towards lower values, and the density is significantly higher than in the other bottom-row plots.
### Key Observations
* The "Unfair" scenario exhibits a bimodal distribution for both "Real" and "Cntf." values of FŶA, suggesting potential instability or multiple equilibrium points.
* The "Unaware" and "FairPFN" scenarios show unimodal distributions for FŶA, indicating a more consistent prediction.
* The bottom row plots, representing the absolute difference in fairness predictions, show a strong skew towards zero for all scenarios, but particularly for "FairPFN". This suggests that the fairness predictions are relatively consistent under the "FairPFN" approach.
* The density values in the bottom-right plot ("FairPFN") are significantly higher than in the other bottom-row plots, indicating a much smaller difference between the two fairness predictions.
### Interpretation
The charts compare the distributions of a fairness metric (FŶA) and the difference between two fairness predictions under different admission scenarios. The "Unfair" scenario shows a bimodal distribution, suggesting that fairness is not consistently achieved. The "Unaware" and "FairPFN" scenarios show unimodal distributions, indicating more consistent fairness predictions. The bottom row plots demonstrate that the "FairPFN" approach results in the smallest difference between the two fairness predictions, suggesting it is the most stable and consistent approach to achieving fairness in law school admissions.
The high density near zero in the "FairPFN" bottom plot suggests that the counterfactual fairness prediction is very close to the original fairness prediction, indicating a strong degree of robustness. The bimodal distribution in the "Unfair" scenario suggests that the fairness metric is sensitive to initial conditions or other factors, leading to multiple possible outcomes. The differences in the distributions highlight the impact of different fairness interventions on the consistency and stability of fairness predictions.