## Line Chart: Information Gain and R² Value vs. Training Steps
### Overview
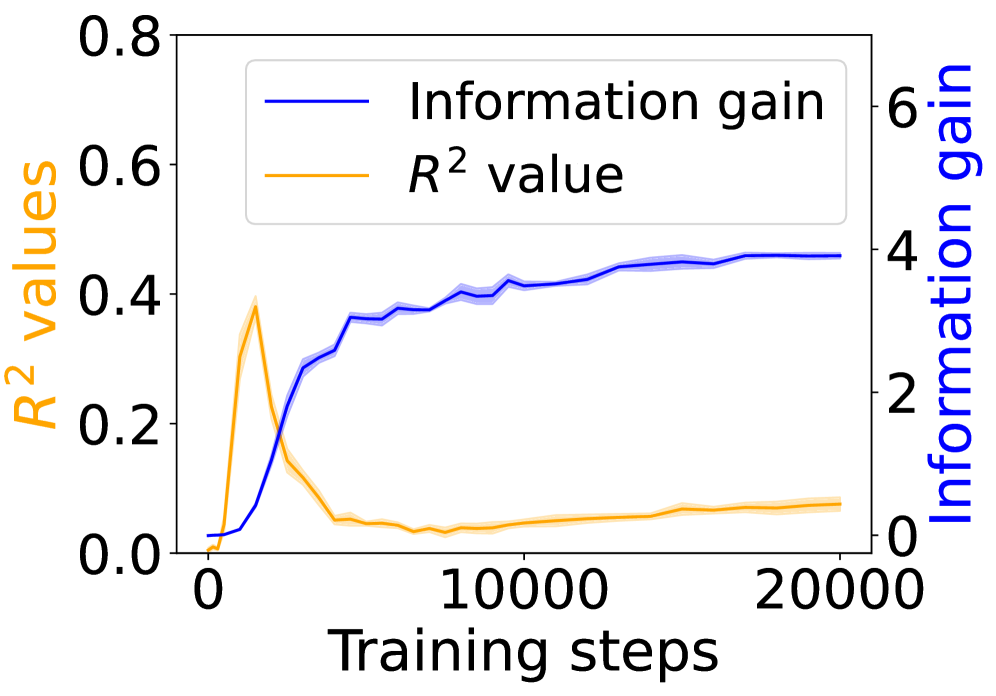
The image is a line chart showing the relationship between training steps and two metrics: Information gain and R² value. The x-axis represents training steps, while the y-axes represent the R² value (left) and Information gain (right). The chart displays how these metrics change over the course of training.
### Components/Axes
* **X-axis:** Training steps, ranging from 0 to 20000.
* **Left Y-axis:** R² values, ranging from 0.0 to 0.8. Labelled "R² values" in orange.
* **Right Y-axis:** Information gain, ranging from 0 to 6. Labelled "Information gain" in blue.
* **Legend:** Located at the top-center of the chart.
* Blue line: "Information gain"
* Orange line: "R² value"
### Detailed Analysis
* **Information gain (Blue line):** The information gain starts at approximately 0 at 0 training steps. It increases rapidly until approximately 5000 training steps, reaching a value of approximately 3.5. From 5000 to 20000 training steps, the information gain continues to increase, but at a slower rate, reaching a final value of approximately 4.5. The blue line has a shaded region around it, indicating uncertainty.
* At 0 training steps, Information gain ≈ 0
* At 5000 training steps, Information gain ≈ 3.5
* At 20000 training steps, Information gain ≈ 4.5
* **R² value (Orange line):** The R² value starts at approximately 0 at 0 training steps. It increases rapidly until approximately 1000 training steps, reaching a peak value of approximately 0.4. After the peak, the R² value decreases rapidly until approximately 5000 training steps, reaching a value of approximately 0.05. From 5000 to 20000 training steps, the R² value increases slightly, reaching a final value of approximately 0.1. The orange line has a shaded region around it, indicating uncertainty.
* At 0 training steps, R² value ≈ 0
* At 1000 training steps, R² value ≈ 0.4
* At 5000 training steps, R² value ≈ 0.05
* At 20000 training steps, R² value ≈ 0.1
### Key Observations
* The information gain generally increases with training steps, with a rapid increase initially followed by a slower increase.
* The R² value initially increases rapidly, then decreases, and finally increases slightly.
* The shaded regions around the lines indicate the uncertainty or variability in the data.
### Interpretation
The chart suggests that as the model trains, the information gain increases, indicating that the model is learning and becoming more informative. The R² value, which represents the goodness of fit, initially increases, suggesting that the model is quickly adapting to the data. However, the subsequent decrease in R² value may indicate overfitting or a change in the data distribution. The final slight increase in R² value suggests that the model is eventually stabilizing. The relationship between information gain and R² value is complex and may depend on the specific characteristics of the model and the data.