## Line Graph: Model Performance Metrics Over Training Steps
### Overview
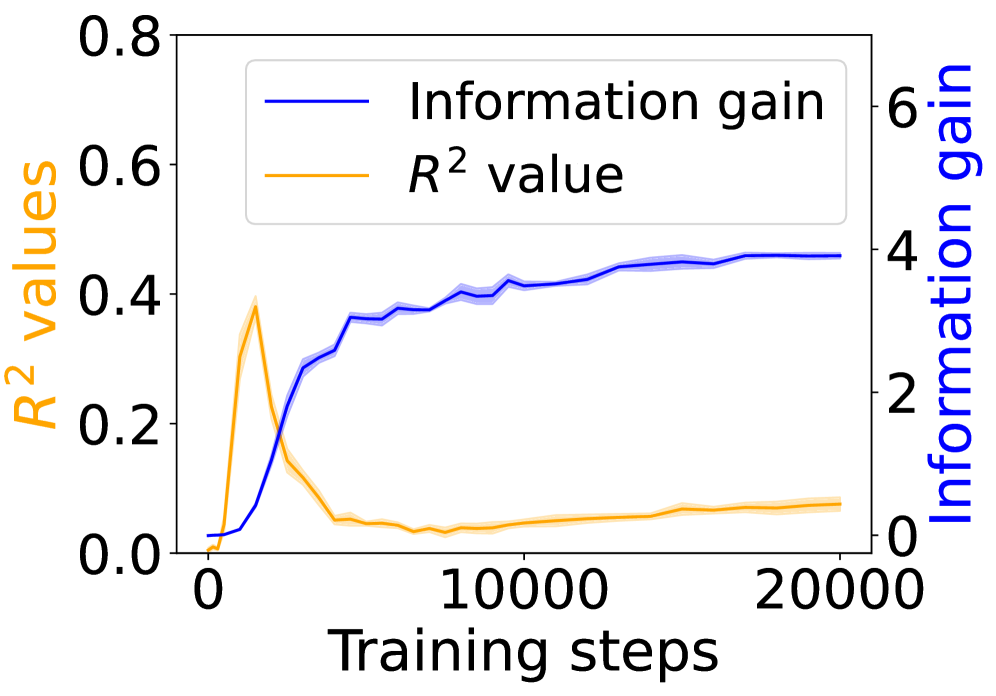
The image depicts a line graph comparing two metrics—**Information gain** and **R² values**—across 20,000 training steps. The graph includes two y-axes: the left axis (orange) represents R² values (0–0.8), and the right axis (blue) represents Information gain (0–6). A legend in the top-left corner distinguishes the two metrics.
---
### Components/Axes
- **X-axis**: Training steps (0 to 20,000, linear scale).
- **Left Y-axis**: R² values (0–0.8, linear scale).
- **Right Y-axis**: Information gain (0–6, linear scale).
- **Legend**:
- Blue line: Information gain.
- Orange line: R² value.
- **Placement**: Legend is top-left; axes are labeled with clear titles.
---
### Detailed Analysis
1. **R² Values (Orange Line)**:
- Starts at **0.0** at 0 steps.
- Peaks sharply at **~0.4** around 5,000 steps.
- Drops to **~0.05** by 10,000 steps and remains flat through 20,000 steps.
- Shaded area (uncertainty) narrows after the initial peak.
2. **Information Gain (Blue Line)**:
- Starts at **0.0** at 0 steps.
- Rises steadily to **~4.0** by 5,000 steps.
- Plateaus at **~4.5** by 20,000 steps.
- Shaded area (uncertainty) widens slightly after 10,000 steps.
---
### Key Observations
- **Inverse Relationship**: R² values peak early (5,000 steps) and decline, while Information gain increases monotonically.
- **Divergence**: After 5,000 steps, R² values drop sharply (~0.4 → 0.05), while Information gain continues to rise (~4.0 → 4.5).
- **Stability**: Both metrics stabilize after 10,000 steps, with minimal further change.
---
### Interpretation
- **R² Decline**: The sharp drop in R² after 5,000 steps suggests the model’s predictive power diminishes as training progresses, potentially due to overfitting or diminishing returns.
- **Information Gain Rise**: The steady increase in Information gain indicates the model is learning to extract more meaningful patterns from the data over time, even as predictive accuracy (R²) declines.
- **Trade-off**: The divergence implies a potential trade-off between model complexity (higher Information gain) and generalization (lower R²). This could reflect a scenario where the model becomes more efficient at utilizing data but less accurate in predictions, possibly due to over-optimization for specific features.
The graph highlights a critical tension in model training: balancing immediate predictive performance (R²) with long-term data efficiency (Information gain).