## Line Graphs: Validation Loss vs FLOPs Across Scenarios
### Overview
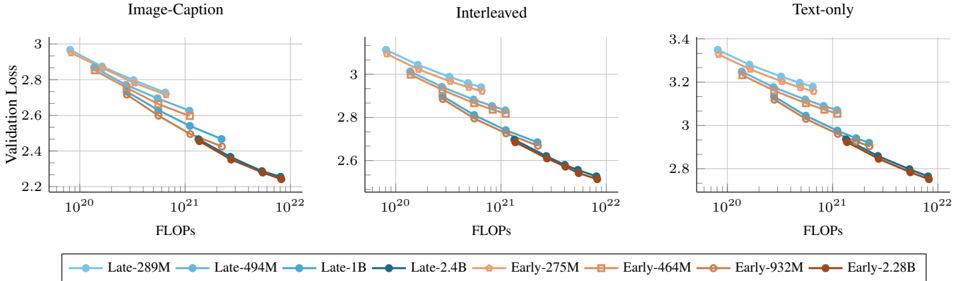
The image contains three side-by-side line graphs comparing validation loss against floating-point operations (FLOPs) for different AI models in three scenarios: Image-Caption, Interleaved, and Text-only tasks. All graphs show downward-trending lines, indicating improved performance (lower loss) as computational resources (FLOPs) increase.
### Components/Axes
- **X-axis**: FLOPs (logarithmic scale: 10²⁰ to 10²²)
- **Y-axis**: Validation Loss (linear scale: 2.2 to 3.4)
- **Legends**:
- **Blue circles**: Late-289M, Late-494M, Late-1B, Late-2.4B
- **Orange squares**: Early-275M, Early-464M, Early-932M, Early-2.28B
- **Graph Titles**:
- Top-left: "Image-Caption"
- Top-center: "Interleaved"
- Top-right: "Text-only"
### Detailed Analysis
#### Image-Caption Graph
- **Lines**:
- Late-289M (blue circles): Starts at ~2.95 (10²⁰ FLOPs), ends at ~2.25 (10²² FLOPs)
- Early-275M (orange squares): Starts at ~2.90, ends at ~2.20
- Other Late/Early models follow similar trends with slight variations in slope.
#### Interleaved Graph
- **Lines**:
- Late-494M (blue squares): Starts at ~2.90, ends at ~2.25
- Early-464M (orange squares): Starts at ~2.85, ends at ~2.20
- All lines show gradual decline, with Late models consistently outperforming Early counterparts.
#### Text-only Graph
- **Lines**:
- Late-1B (blue circles): Starts at ~3.35, ends at ~2.75
- Early-932M (orange squares): Starts at ~3.30, ends at ~2.70
- Highest validation loss values across all scenarios, with steeper declines for Late models.
### Key Observations
1. **Consistent Trend**: All models show reduced validation loss as FLOPs increase, with Late models outperforming Early models at equivalent FLOP levels.
2. **Scenario Differences**:
- Text-only tasks require significantly more resources (higher baseline loss) compared to Image-Caption/Interleaved.
- Early models exhibit shallower slopes, suggesting diminishing returns at higher FLOP counts.
3. **Model Scaling**: Larger models (e.g., Late-2.4B vs. Late-289M) achieve lower final loss but require exponentially more FLOPs.
### Interpretation
The data demonstrates a clear trade-off between computational cost and performance across tasks. Late models (likely optimized architectures) achieve better efficiency, requiring fewer FLOPs for comparable loss reduction. The Text-only scenario’s higher resource demands highlight the complexity of language tasks. Early models, while resource-intensive, show limited gains at scale, suggesting architectural inefficiencies. These trends align with principles of model scaling laws, where performance improvements plateau as compute increases beyond a threshold.