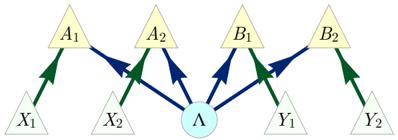
## Diagram: Network Flow
### Overview
The image is a diagram illustrating a network flow between several nodes. The nodes are represented by triangles and a circle, and the flow is indicated by arrows. The diagram shows a central node receiving input from multiple sources and distributing output to other nodes.
### Components/Axes
* **Nodes:**
* Triangles labeled A1, A2, B1, B2 (top row, yellow fill)
* Triangles labeled X1, X2, Y1, Y2 (bottom row, light green fill)
* Circle labeled Λ (center, light blue fill)
* **Arrows:**
* Green arrows indicate flow from bottom row triangles to top row triangles.
* Blue arrows indicate flow from top row triangles to the central circle (Λ) and from the central circle to the top row triangles.
### Detailed Analysis
* **Node X1:** Has a green arrow pointing to node A1.
* **Node X2:** Has a green arrow pointing to node A2.
* **Node Y1:** Has a green arrow pointing to node B1.
* **Node Y2:** Has a green arrow pointing to node B2.
* **Node A1:** Has a blue arrow pointing to node Λ.
* **Node A2:** Has a blue arrow pointing to node Λ.
* **Node B1:** Has a blue arrow pointing to node Λ.
* **Node B2:** Has a blue arrow pointing to node Λ.
* **Node Λ:** Has blue arrows pointing to nodes A2 and B1.
### Key Observations
* Nodes X1, X2, Y1, and Y2 are input nodes, each feeding into one of the top row nodes (A1, A2, B1, B2).
* Nodes A1, A2, B1, and B2 act as intermediate nodes, receiving input from the bottom row and sending output to the central node (Λ).
* Node Λ is a central node, receiving input from A1, A2, B1, and B2, and distributing output to A2 and B1.
* The flow is not symmetrical. Node Λ sends output only to A2 and B1, not to A1 or B2.
### Interpretation
The diagram represents a network where data or resources flow from the X and Y nodes to the A and B nodes, then converge at the central node Λ. The central node then redistributes the flow back to a subset of the A and B nodes. This could represent a system where data is collected from multiple sources, processed centrally, and then selectively distributed to specific destinations. The asymmetry in the output from Λ suggests that certain nodes (A2 and B1) are prioritized or have different roles in the network.